

Equity Markets Rebound on U.S. Tariff Pause in Q2
Global equity markets were volatile in Q2, coinciding with President Trump’s tariff rates announcement and the subsequent pause in early April.
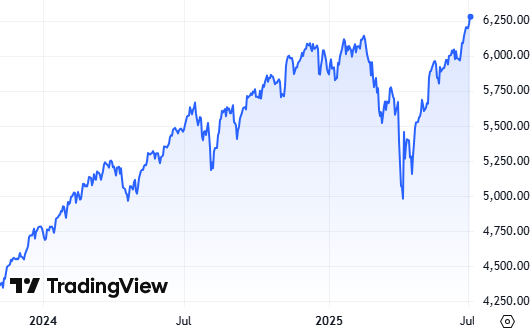
Coming into Q2, equity markets were in decline as investors anticipated President Trump’s tariff “Liberation Day” announcement on April 2nd. When announced, the new tariff rates were higher than many had anticipated. In retaliation, China and the European Union announced their own tariffs on the U.S., which spooked investors, causing equity markets to decline sharply. From its peak in February, the S&P 500 Index declined roughly 21%.1
Shortly thereafter, on April 9th, President Trump announced a 90-day pause on implementing his tariff policy. Financial markets reacted favorably to the pause, with equities and other risk assets rebounding significantly from their lows. From its April low, the S&P 500 Index rallied approximately 28% to end Q2, and has since reached new highs.1
Source: TradingView.com, As of July 3, 20251
U.S. Fiscal Policies Remain Key Factors to Watch
In the first quarter, business, consumer and investor confidence showed signs of weakening as uncertainty about President Trump’s tariff and tax policy weighed on confidence. Weaker confidence can translate into conservative spending decisions and can result in a slowing of the economy. Recent data has indicated some slowing of economic growth. If clarity on U.S. government fiscal policies and their impact on the economy can improve, businesses and consumers may have greater confidence in their outlook. This could then translate to increased spending, investment, and general economic activity.
Tariff Policy
The 90-day pause on tariffs is set to expire on July 9th, with a potential tariff implementation date of August 1st. It is still uncertain whether deals will be reached, the current deadline will remain, the original Liberation Day tariff rates will be reinstated, or entirely new tariffs will be announced. The Trump administration has announced tariff frameworks for some countries, including China and the United Kingdom, but the full economic implications are still unknown.
Although the U.S. still does not have firm tariff policies in place for every country, President Trump has indicated that the ultimate tariff levels could be less than what was originally announced in early April. If tariffs end up being more manageable for companies and consumers, the global economy could remain on a stable growth path.
Tax & Budget Policy
President Trump and the Republican-led Congress passed the bill Republicans have called the “One Big Beautiful Bill.” This bill extends and makes permanent several tax cuts originally enacted in the 2017 Tax Cuts and Jobs Act, which were set to expire at the end of this year. Failure to extend the tax cuts could have had a negative impact on the U.S. economy as tax rates would have increased, raising the tax expense of many Americans and businesses.
Now that the bill has passed, investors may shift some focus to the federal deficit and rising U.S. debt levels. Investors will be watching for potential federal spending cuts that fiscal conservatives in Congress may have pushed for in return for their vote on the tax bill. Federal spending is a key component of U.S. economic growth and if federal spending is cut significantly, it can negatively impact the U.S. economy.
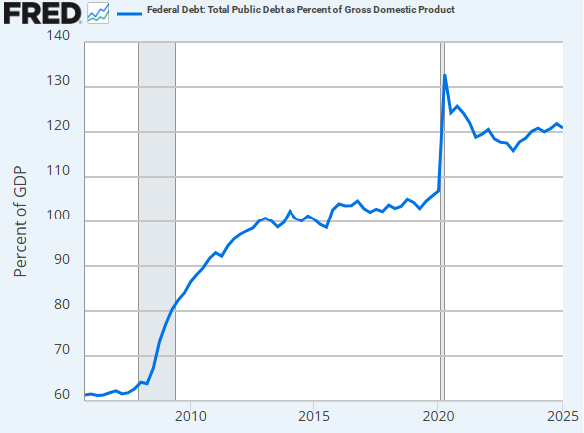
U.S. politicians appear to be increasingly concerned with the growing U.S. federal debt. The U.S. has been running higher budget deficits for years, resulting in the U.S. total debt level exceeding $36 trillion, roughly 120% of GDP as of Q1 2025.3 Although politicians have raised concerns about unsustainable debt levels, it remains unclear whether meaningful fiscal policies will be enacted to reduce the risks of high U.S. debt.
If the U.S. cannot effectively control the federal budget deficit through higher revenues and/or lower spending, investors may become cautious on U.S. bonds. This could push interest rates higher and potentially hurt the U.S. economy.
Source: U.S. Office of Management and Budget and Federal Reserve Bank of St. Louis. FRED. As of Q1, 20254
Foreign Policy
The second quarter also marked heightened conflict between Israel and Iran in the Middle East. The United States also became involved in the conflict, by the targeted bombing of Iranian nuclear-related sites to prevent Iran’s development of a nuclear weapon. If the risk of Iran developing a nuclear weapon has been dramatically reduced, global investors could see this as a bullish backdrop over the short term.
The U.S. economy is heavily driven by U.S. consumer spending. Recent conflicts in the Middle East and elsewhere have generally had limited impact on U.S. financial markets and the economy. Although foreign conflicts can bring global uncertainty and short-term shocks to financial markets, investors have tended to look past these conflicts and focus on the long-term potential of the U.S.
Economic and Corporate Growth Remains Stable
While U.S. fiscal policies have yet to be fully resolved, economic and corporate growth remains fairly stable.
Although political and economic uncertainty remains, it does not appear severe enough to significantly weaken economic activity. The strong rebound in global equity and credit markets may have reflected that view as well.
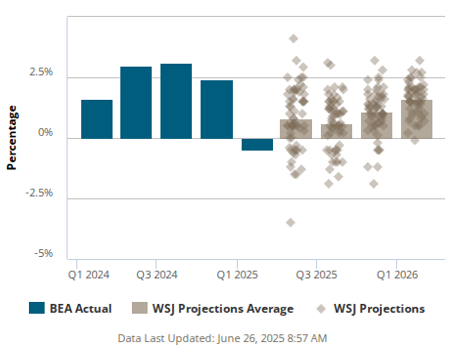
In Q1 2025, U.S. real GDP posted a negative 0.5% reading, indicating a slight contraction in the U.S. economy.5
Source: American Staffing Association6
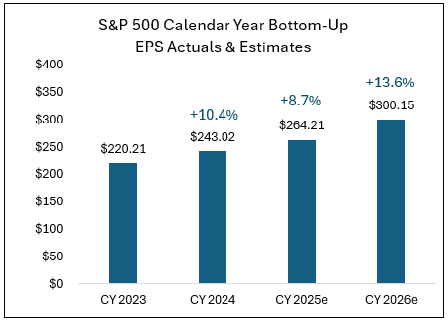
Based on the projections of economists in the Wall Street Journal Economic Forecasting Survey, U.S. real GDP is projected to reaccelerate in Q2 and continue to show growth into 2026. U.S. companies are also anticipated to benefit from a stable, growing U.S. economy. The aggregate estimated earnings per share (EPS) of companies in the S&P 500 Index are forecasted to grow this year and through 2026. In this environment, investors could continue to drive support for U.S. equities and other risk assets.
Markets Pricing in Fed Rate Cuts Before Year End
The U.S. Federal Reserve has remained patient on cutting the fed funds rate, waiting for signs that inflation is steadily declining toward its 2% target. Economic growth is showing signs of slowing, which can translate to lower inflation. President Trump’s final tariff policy remains an unknown factor in the Fed’s monetary policy decisions. Until tariff policy is solidified and any potential tariff impacts on the economy are known, the Fed could remain on hold with any rate cuts.
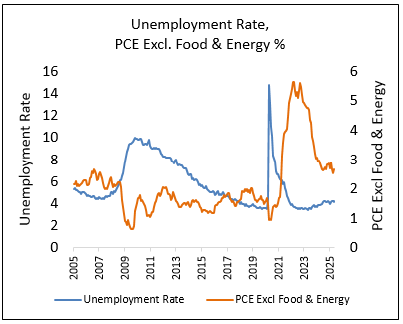
The Federal Reserve will continue to monitor inflation and unemployment data to help determine whether to cut the fed funds rate. The Personal Consumption Expenditures Excluding Food & Energy Index, a measure of inflation, was +2.7% in May, which was a slight uptick from April. This latest inflation data does not directly support significant Fed rate cuts as inflation remains above the Fed’s 2% target. The Fed may need to see inflation move closer to its 2% target before cutting rates.
The U.S. unemployment rate has also remained relatively low. The June unemployment rate measured 4.1%, which remains at the lower end of its historical range. There have been some announcements of potential workforce reductions from the federal government and technology-related companies, but the labor market has not shown widespread weakness. If the job market remains strong, the Fed may not feel pressure to adjust its current monetary policy.
As it currently stands, the Federal Reserve has set the fed funds rate target at 4.25%-4.50%. This target range is anticipated to stay at that level until the Fed is comfortable with inflation and/or becomes uncomfortable with higher unemployment rates.
Source: FactSet7
The Fed has not shown a willingness to make speculative forecasts and prefers actual economic data to support its monetary policy decisions. Unlike the Fed, investors try to anticipate monetary policy
before any formal Fed decisions are announced. According to the CME FedWatch Tool, which provides some insights into investors’ views on the future fed funds rate, financial markets are pricing in a high probability that the Fed could cut the fed funds rate between 25 and 75 basis points (0.25%-0.75%) before the end of the year.
Lower interest rates can be stimulative for an economy. If the Fed returns to a stimulative monetary policy and cuts interest rates, investors may find this bullish and continue to support equities and other risk assets. Bond investors may also find rate cuts favorable as falling interest rates could drive existing bond prices higher.
Source: U.S. Bureau of Labor Statistics. U.S. Bureau of Economic Analysis. PCE year-over-year change. FRED8, 9
Q2 Market Review
Equity Markets
Global equity markets rallied significantly in Q2 following weaker U.S. markets in Q1. As investors continue to wait for clarity on President Trump’s tariff policy, the rally in global equity markets may be reflecting greater investor confidence and potentially better days ahead.
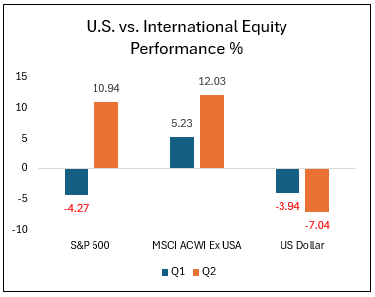
In the U.S., after a steep decline into early April, the S&P 500 and NASDAQ 100 indices both rebounded sharply and reached new highs in June. For the full second quarter, the S&P 500 Index rallied 10.94% and the NASDAQ 100 Index rallied 17.86%.1 Investor appetite for growth and artificial intelligence-related companies remained strong as the S&P 500 Growth Index was up 18.94% in the quarter and is up 8.86% YTD.1 With U.S. large cap equity indices rallying to new highs, valuations have become elevated again, a potential concern for valuation-sensitive investors.
Smaller U.S. companies’ stocks have yet to fully recover from their decline. Smaller companies can be more sensitive to economic activity and interest rates. If economic activity slows and interest rates remain elevated, smaller companies could continue to lag. If the Fed restarts interest rate cuts and President Trump’s new fiscal policies are economically stimulative, smaller and more economically-sensitive companies could benefit.
International equity markets have been strong this year. The MSCI ACWI ex USA Index, which measures both non-U.S. developed and emerging market companies’ stock performance, rallied 12.03% in Q2.1 Foreign currency
appreciation against a declining U.S. dollar also benefited U.S. investors with allocations to non-U.S. equities this year.
Source: 2025 quarterly total returns. Morningstar Direct1
Global investors may have been reducing some of their overweight exposure to U.S. equities, which had several years of outperformance, and increasing exposure to non-U.S. equities. Equity valuations outside of the U.S. remain at a discount relative to the U.S., which could continue to attract investors to non-U.S. equity markets.
Bond Markets
Bonds generally performed well on a total return basis in the second quarter, and income generation was a key driver. Like equities, credit-sensitive bonds also rebounded in Q2 from a challenging Q1, rewarding bond investors willing to take on additional risk in bonds.
Interest rates were volatile across the yield curve in Q2, with yield shifts depending on the maturities of the bonds. Short-term rates will generally be dependent on the Fed’s monetary policy, while longer-term rates may be subject to bond investors’ views on the long-term trajectory of U.S. debt levels. This year, the biggest shifts in yields have been in the intermediate-maturity part of the yield curve, which is often tied to inflation expectations over the coming years.
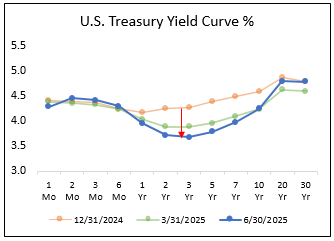
In addition to bonds generating income for investors, Treasury yields have fallen across 3- to 10-year maturities, as shown in the following chart.
Source: Treasury.gov11
This decline in yields may indicate investors believe that inflation will be lower in the future. As yields have declined across these maturities, their corresponding bond prices have rallied.
This combination of yield plus price appreciation has benefited bond investors this year. The Bloomberg U.S. Aggregate Bond Index, a measure of investment grade U.S. bonds, has generated a total return of 4.02% this year. Comparatively, the riskier Bloomberg U.S. High Yield Corporate Bond Index has generated a total return of 4.57%, rewarding bond investors willing to take on greater credit risk.1
Commodity Markets
Gold prices showed persistent strength in Q2, as the U.S. dollar continued to decline and geopolitical uncertainty remained elevated. Gold prices rallied over 24% this year through Q2.1 Oil prices were very volatile in the quarter. WTI Crude Oil fell below $60 per barrel in early April but spiked to over $78/bbl when the U.S. struck Iranian nuclear sites in June.12 Since then, prices have fallen back to the mid-$60s. This sharp decline could be due to the perceived reduction in the risk of Iran creating a nuclear weapon over the near term.
In addition to the tensions in the Middle East and in the Russia/Ukraine conflict, investors will continue to monitor global oil supply and demand dynamics to determine an appropriate price level for oil. Oil demand is generally tied to the health of the global economy and investors will need to monitor economic growth around the world accordingly.
Currency Markets
The U.S. Dollar Index has depreciated against other foreign currencies this year, which has added positive performance for U.S. investors with allocations to non-U.S. currency-denominated assets. Through Q2, the U.S. Dollar Index has declined 10.7% this year.1 Global investors’ desire for U.S. assets relative to non-U.S. assets could continue to drive the direction of the U.S. dollar.
DYNAMIC PORTFOLIOS
The Dynamic models represent diversified, multi-asset portfolios that deviate from conventional ‘asset allocation’ methodology. The Dynamic strategy is optimized on a quarterly basis utilizing an ‘Expected Tail Loss’ methodology. This method isn’t solely focused on returns; rather, it seeks to achieve the most consistent, risk-adjusted performance within the investment universe available, characterized by its dynamic and adaptive approach. Utilizing advanced quantitative analysis and a risk overlay system, the Dynamic strategies aim to deliver consistent risk-adjusted returns tailored to investors’ unique risk tolerances and objectives.
Performance Review
The Dynamic models performed in alignment with their respective risk tolerances during Q2 2025. The quarter was marked by a continued market rally, driven by optimism amid macroeconomic uncertainty, increased retail participation in market dips, and growing expectations for fiscal policy expansion. Aggressive models benefited from an overweight to the technology sector and a continued overweight allocation to the broader market (S&P 500), both of which supported relative outperformance. In contrast, defensive sectors underperformed, weighing on results.
Additionally, the long/short commodities strategy lagged this quarter, primarily due to increased market choppiness that challenged both sides of the trade. Among the more conservative and moderate models, a notable overweight to gold remained in place following its strong Q1 run. While gold posted moderate gains in Q2, the allocation ultimately detracted from performance relative to benchmarks, as equities outpaced alternative assets during the quarter’s rally.
Positioning
Changes across Dynamic models were limited and implemented late in the quarter, with no impact on Q2 returns. Notable adjustments included increased allocations to industrials across all risk levels, and an uptick in alternatives and the long/short strategy within conservative models. Aggressive models maintained a tech overweight but trimmed broad market exposure in favor of financials, industrials, and alternatives. Consumer discretionary was reduced across most tiers, except for a modest add at the moderate level. Utilities were reduced in moderate and aggressive models.
Minimal shifts in conservative assets. The dynamic conservative model rotated from short-term treasuries into an aggregate bond fund, while the moderately conservative model moved in the opposite direction—favoring short-term treasuries for a more defensive stance.
PRESERVE & PARTICIPATE PORTFOLIOS
The Preserve & Participate models take a modern, risk-first approach to portfolio construction. Instead of traditional asset allocation, the strategy uses Q MethodologyTM to optimize portfolios based on historical drawdown targets and risk-adjusted return potential. By combining equities, fixed income, and commodities through low-cost ETFs, the models aim to maximize return for each unit of risk taken—aligning with each investor’s unique risk profile.
Performance Review
The Preserve & Participate models performed in alignment with their respective risk tolerances during Q2 2025. However, there was a notable disparity in performance between the moderate and conservative models versus their more aggressive counterparts. Aggressive models led performance, primarily driven by a significant overweight to the technology sector—one of the strongest performers during the quarter’s rally. In addition, allocations to high-momentum sectors such as consumer discretionary and communication services contributed meaningfully to returns, as investor sentiment favored growth-oriented, risk-on exposures.
Conversely, the more conservative models maintained heavier allocations to gold, which helped keep performance in positive territory but limited upside relative to equity-heavy peers. Defensive sector exposures, including healthcare and consumer staples, were a drag on performance—particularly within the moderate risk tier where healthcare underperformed.
Overall, returns reflected the dynamics of a volatile, headline-driven market. Despite ongoing uncertainty around fiscal and trade policy, momentum-driven sectors ultimately captured investor interest and delivered strong gains across the more risk-tolerant allocations.
Positioning
The Preserve & Participate models underwent a few targeted rebalances during the quarter, finishing with several notable shifts. Across risk assets, gold was added to the more aggressive models, while positions were largely maintained in the conservative tiers. There were reductions in healthcare across the higher risk models, as well as a pullback in consumer discretionary—though P&P 30 saw a significant add to the sector. P&P 60 also added exposure to small-cap growth.
Changes in conservative allocations reflected differing views on interest rate sensitivity across risk tiers. P&P 5 further reduced duration by trimming short-term bond exposure. P&P 10 and P&P 20 both extended duration, with increased allocations to intermediate and long-term bonds. P&P 20 also introduced exposure to extended-duration assets. In contrast, P&P 30 reduced duration by rotating out of longer-term bonds in favor of more core aggregate exposure.
CONCENTRATED GROWTH SMA PORTFOLIOS
The Concentrated Growth SMA is a focused portfolio of ~40 U.S. large- and mid-cap stocks selected for high returns on invested capital (ROIC), strong profitability, and reinvestment potential. Using a systematic, quarterly ranking process and a cyclically adjusted ROE screen, the strategy targets companies with scalable business models and long-term growth prospects. Direct security ownership helps minimize fees and improve long-term outcomes.
Performance Review
The Concentrated Growth SMA underperformed the broader market (Russell 3000) in Q2, despite delivering strong absolute returns. The portfolio was supported by standout contributors including NVIDIA (NVDA), Netflix (NFLX), and Jabil (JBL), but was weighed down by underperformance from Bristol-Myers Squibb (BMY), Coca-Cola Consolidated (COKE), and AbbVie (ABBV). Growth stocks led the quarter as investor sentiment shifted decisively toward risk-on positioning, though the strategy’s structural underweight to the “Magnificent Seven” contributed to relative underperformance. We remain committed to our disciplined approach—focused on companies with high returns on capital and sustainable profitability—and will continue to monitor opportunities closely in what remains an evolving market landscape.
Positioning
MTD, LII, NEU, AMP, CSL, COR, DECK, ORLY, WSM, TREX, BLDR, MANH, FICO, FDS, TXRH, COKE, DPZ, LECO, BCO, QLYS, NFLX, ADP, CAH, MCK, JBL, BKNG, OMC, AAPL, SCI, NTAP, BMY, NVDA, AN, YUM, MA, FTNT, ABBV, OTIS, DKS, EXP
QUALITY DIVIDEND SMA PORTFOLIOS
The Quality Dividend SMA targets financially strong U.S. large-cap companies with a history of stable and growing dividends. Rather than chasing high yields, the strategy emphasizes balance sheet strength, earnings consistency, and dividend coverage, selecting the top dividend growers in each sector. This results in a diversified, lower-volatility portfolio built for income and long-term growth.
Performance Review
The Quality Dividend SMA underperformed its benchmark in Q1, as value stocks lagged their growth counterparts during the quarter. The market rally was led by the “Magnificent Seven,” which returned nearly 20%, leaving dividend-focused strategies relatively behind. Despite this, the portfolio’s tilt toward high-quality, dividend-paying names helped dampen volatility in a choppy environment. Notable detractors included Chevron (CVX), Omnicom Group (OMC), PepsiCo (PEP), and Kimberly-Clark (KMB), while key contributors to performance included Ralph Lauren (RL), Morgan Stanley (MS), and Texas Instruments (TXN). We remain confident in the portfolio’s positioning and its focus on dividend consistency and balance sheet strength, and we will continue to monitor opportunities and risks closely as market conditions evolve.
Positioning
BBY, OMC, TJX, IPG, RL, CVX, LIN, APD, REG, SWK, EXR, SRE, AVB, ATO, SNA, XOM, QCOM, USB, JNJ, MDT, PFE, CSCO, LMT, PEP, PPG, TXN, MS, KMB, CMCSA, AWK, RF, ADM, EOG
MOAT SMA PORTFOLIOS
The MOAT SMA invests in U.S. large-cap companies with durable competitive advantages, or “economic moats,” such as brand strength, cost efficiency, or regulatory barriers. Leveraging Morningstar’s moat ratings and fundamental valuation methods, the strategy seeks to build a risk-aware, long-term growth portfolio focused on capital preservation and consistent outperformance
relative to broad market indices.
Performance Review
The MOAT SMA delivered a solid absolute return in Q2, benefiting from the continued strength in high-quality U.S. companies. However, it lagged the broader market, which was driven primarily by momentum-heavy names—particularly the “Magnificent Seven” and AI-related growth stocks. This relative underperformance is consistent with the strategy’s philosophy, which emphasizes companies with durable competitive advantages and attractive valuations, rather than chasing short-term growth narratives.
As a result, the portfolio maintains structural underweights to many of the high-multiple, high-momentum names that dominated the quarter’s rally. While this positioning may cause the strategy to lag in surging, sentiment-driven markets, it also enhances downside protection and promotes long-term consistency—hallmarks of a true moat-based approach. We remain confident in the long-term value of this discipline and will continue to prioritize quality, sustainability, and risk-aware investing.
Positioning
ADSK, AMZN, SNPS, ORCL, MSFT, PEP, SCHW, AMAT, LRCX, CAT, CRM, CLX, WDAY, HSY, IEX, NDSN, MANH, CDNS
MO, GILD, EFX, BIO
NXPI, VEEV, CTVA, MKTX, BFB, ADBE, BMY, BA, AMGN, DIS, USB, PFE, UPS, DHR, MRK, NKE, MDLZ, ZBH, STZ, NOC, MAS, MCHP, GOOGL, TMO, HII, A, EL, WST, IFF, ALLE, CPB, TER, MPWR, TRU, GEHC, KVUE
FLEXTREND PORTFOLIOS
The FlexTrend portfolios are structured to attempt to participate in the upside of persistent positive trending U.S. equity and credit markets and to protect value in persistent negative trending markets. The portfolios can significantly reduce risk and raise cash and/or conservative fixed income exposure in large market drawdowns. The portfolios are partially allocated to non-trend, defensively-managed equity and fundamentally-oriented fixed income strategies to attempt to provide further diversification. The portfolios may underperform in trendless or choppy market environments. The FlexTrend portfolios utilize mutual funds and ETFs to construct the portfolios.
Performance Review
The FlexTrend portfolios performed well in Q2 as U.S. equity and bond markets rallied. Elevated volatility in Q2 provided a good environment to showcase our preference for tactical strategy diversification in the FlexTrend portfolios. Within our core, long-only equity allocation, our exposure to higher-quality growth stocks and passive exposure to the S&P 500 Index were strong contributors in the quarter. Exposure to dividend growth companies was also additive in Q2. Across our tactical allocations, our position in a valuation-sensitive equity manager added value as the manager increased equity exposure during the market decline and reduced it after the rally later in the quarter.
Exposure to hedged equity managers also positively contributed, but the hedged nature of these strategies resulted in a modest drag on overall performance for the quarter. Our exposure to a trend-following manager also
dragged on the portfolios as the strategy’s shorter-term trend-following methodology resulted in negative whipsaw when equities declined then quickly rallied. Although U.S. equities experienced significant volatility in Q2, our FlexTrend trading signal remained bullish throughout the quarter, benefiting the portfolios.
This slower-moving intermediate-term trend signal allowed us to hold through the volatility without experiencing a negative whipsaw effect. Across the FlexTrend portfolios’ bond allocation, exposures to tactical and credit-sensitive bond managers were the strongest contributors to performance as credit-sensitive bonds generally outperformed in Q2. Our exposure to a moderately-conservative short-term bond manager also positively contributed but underperformed the other credit-heavy bond managers in the quarter.
Positioning
The FlexTrend portfolios maintain exposure to a mix of core U.S. equities and tactical, risk-managed equity strategies. Within the core equity allocation, we emphasize a blend of cost-efficient index and higher-quality growth-oriented investment strategies. On the tactical side, we are allocated across option-enhanced equity, trend-sensitive, and valuation-aware strategies. We continue to actively manage a portion of the equity allocation in response to medium-term market trends. This position remains fully invested at this time as U.S. large cap equities remain in a persistent medium-term bullish trend.
The FlexTrend portfolios continue to allocate to actively-managed, research-driven fixed income strategies. We maintain a preference for short- and intermediate-duration bond managers to help limit sensitivity to interest rate fluctuations and mitigate overall portfolio volatility. We believe our allocation to actively-managed bond strategies has the potential to add value in volatile bond market environments over time.
FOCUSED INCOME PORTFOLIOS
The Focused Income portfolios primarily invest in higher income-generating assets. This can include dividend-paying stocks, option-income strategies, investment grade bonds, high yield bonds, emerging markets debt and real estate securities. The portfolios’ risk exposure is not tactically managed, which can result in poor performance in weak U.S. market environments. The Focused Income portfolios utilize mutual funds and ETFs to construct the portfolios.
Performance Review
The Focused Income portfolios continued to perform well as equity-related and credit-sensitive income-generating assets rallied in Q2. Dedicated exposure to international dividend growth companies was the strongest contributor in the quarter as international equities continued to show strength this year. Exposure to multi-asset income strategies, including tactical income and closed-end funds, also positively contributed in the quarter. Other positive contributors in Q2 included option-income, U.S. dividend growth, mid cap dividend-paying companies and global real estate income strategies.
Across the portfolios’ fixed income allocation, tactical credit-sensitive bond managers generally outperformed as riskier parts of the bond markets rebounded from early-quarter lows. For our Focused Income – Ultra-Conservative portfolio, allocation to active bond managers was a solid contributor to overall performance in Q2. Exposure to core, tactical bond managers was the strongest contributor in Q2 as their higher income-generation was a benefit to performance. Our exposure to short-term credit-sensitive bond managers also positively contributed in Q2.
Positioning
The Focused Income portfolios continue to emphasize investments that offer higher income potential. This includes exposure to strategies centered on dividend growers, high-yielding equities, option-based income, tactical yield opportunities, closed-end fund structures, and global real estate income. We believe this diversified mix supports strong income generation while also allowing for the possibility of capital growth over time.
The portfolios remain allocated to income-oriented, credit-driven fixed income strategies. Our preference is for both core and tactical bond managers with the flexibility to actively adjust credit exposure in response to changing market dynamics. We also maintain diversification across short- and intermediate-duration bonds to help manage interest rate sensitivity and broaden our fixed income exposure.
TOTAL RETURN/TOTAL RETURN ETF PORTFOLIOS
The Total Return and Total Return ETF portfolios provide long-term diversified exposure across U.S. and international equities, bonds and income-generating assets. The portfolios are structured to participate in the upside of bullish equity and credit markets and provide moderate income generation. The portfolios’ risk exposure is not tactically managed and can result in poor performance in weak market environments. The Total Return portfolios utilize mutual funds and ETFs to construct the portfolios, while the Total Return ETF portfolios only utilize ETFs to construct the portfolios.
Performance Review
The Total Return portfolios performed well in Q2 as U.S. and international equities and bonds rallied. Equity strength appeared in several areas during the quarter, including international small caps, U.S. large and mid cap growth companies, emerging markets, international high-quality companies, and actively-managed global equity strategies. The portfolios’ exposure to tactical multi-asset income and closed-end fund strategies also positively contributed in the quarter.
In the Total Return taxable bond allocation, our allocation to fundamentally-driven, credit-sensitive bond managers added value in Q2 as credit rebounded following the decline in Q1. In the Total Return Muni bond allocations, performance was a bit different than the taxable bond allocation. Within munis, intermediate-term higher quality bonds generally outperformed, while credit-sensitive, longer-duration munis underperformed. In this environment, our fundamentally-driven muni bond manager allocations detracted relative to core muni bond markets in Q2.
Positioning
The Total Return portfolios retain a broad mix of U.S. and international equity exposure, complemented by allocations to income-oriented investments. Our equity exposure spans a range of management styles, market capitalizations, and global regions to ensure broad diversification. On the income side, we emphasize multi-asset income strategies that provide diversified exposure across dividend-focused stocks, credit-driven bonds, option-based income, and closed-end funds. Our portfolio construction draws from a combination of actively-managed and index-based strategies to provide opportunities to add value while managing investment
expenses.
Within fixed income, the portfolios remain allocated to actively managed bond strategies. We maintain a balance between core, high-quality investment grade managers and more flexible, tactical bond strategies with the ability to adapt to shifting market conditions. We believe these managers bring the expertise and adaptability needed to navigate a dynamic fixed income landscape.
U.S. CORE/U.S. CORE ETF PORTFOLIOS
The U.S. Core and U.S. Core ETF portfolios provide long-term exposure to core U.S. equity and bond markets. The portfolios may have some exposure to non-core markets, including foreign assets and lower-quality fixed income. The portfolios are structured to participate in the upside of bullish U.S. equity and credit markets. The portfolios’ risk exposure is not tactically managed and can result in poor performance in weak U.S. market environments. The U.S. Core portfolios utilize mutual funds and ETFs to construct the portfolios, while the U.S. Core ETF portfolios only utilize ETFs to construct the portfolios.
Performance Review
The U.S. Core portfolios rallied in Q2 as U.S. equity and credit-sensitive bond markets rebounded from their decline in Q1. Exposures to U.S. large and mid cap growth stocks were the strongest contributors to the portfolios in the quarter. The portfolios’ allocation to dividend growth, valuation-oriented and small cap equity strategies also positively contributed in the quarter, albeit less than growth stocks in Q2.
In the U.S. Core portfolios’ taxable bond allocation, our overweight to actively-managed bond managers continued to add value in Q2 as their general overweight to credit-sensitive bonds was rewarded as credit rallied. Across the U.S. Core Muni strategies, our allocation to credit-sensitive muni bond managers was not as supportive as their taxable bond manager counterparts, as the muni managers’ positioning generally underperformed in Q2.
Positioning
The U.S. Core portfolios maintain broad exposure to U.S. equities through a blend of market cap-weighted index, fundamentally-weighted index, and actively-managed strategies. We emphasize diversification across investment styles and company sizes, with a preference for investment strategies focusing on higher-quality businesses demonstrating consistent growth potential.
On the fixed income side, the U.S. Core portfolios remain allocated to a mix of traditional core investment-grade bond strategies and more flexible, opportunistic bond strategies. We continue to favor core bonds for their potential to provide downside protection during equity market stress. At the same time, we maintain exposure to tactical bond managers who can selectively increase credit exposure when credit markets decline, and valuations improve.
Resources
1 Morningstar Direct. Performance provided as total returns. U.S. Mid Caps is defined by the Russell Mid Cap TR USD index. U.S. Small Caps is defined by the Russell 2000 TR USD index. U.S. Growth is defined by the Russell 3000 Growth TR USD index. U.S. Value is defined by the Russell 3000 Value TR USD index. International Developed is defined by the MSCI EAFE NR USD index. Emerging Markets is defined by the MSCI Emerging Markets NR USD index. U.S. Agg Bond is defined by the Bloomberg U.S. Aggregate Bond TR USD index. U.S. Investment Grade Corp is defined by the Bloomberg U.S. Corporate Investment Grade TR USD Index. U.S. High Yield is defined by the Bloomberg High Yield Corporate TR USD index. Broad Commodities is defined by the Bloomberg Commodity TR USD index. WTI Crude Oil is defined by the Bloomberg Sub WTI Crude Oil TR USD Index. Gold is defined by the Bloomberg Sub Gold TR USD Index. Industrial Metals is defined by the Bloomberg Sub Industrial Metals TR USD Index. Short-Term Treasuries defined by the Bloomberg 1-3 Yr U.S. Treasury TR USD index. Intermediate-Term Treasuries defined by the Bloomberg Intermediate U.S. Treasury TR USD Index. Long-Term Treasuries defined by the Bloomberg Long-Term U.S. Treasury TR USD Index.
2 TradingView.com. S&P 500 Index. Retrieved from https://www.tradingview.com/symbols/SPX/ on 7/3/25.
3 U.S. Department of the Treasury. Fiscal Service, Federal Debt: Total Public Debt [GFDEBTN], retrieved from FRED, Federal Reserve
Bank of St. Louis; https://fred.stlouisfed.org/series/GFDEBTN, July 1, 2025.
4 U.S. Office of Management and Budget and Federal Reserve Bank of St. Louis, Federal Debt: Total Public Debt as Percent of Gross Domestic Product [GFDEGDQ188S], retrieved from FRED, Federal Reserve Bank of St. Louis; https://fred.stlouisfed.org/series/GFDEGDQ188S, June 30, 2025.
5 U.S. Bureau of Economic Analysis. Gross Domestic Product, 1st Quarter 2025 (Third Estimate), GDP by Industry, and Corporate
Profits (Revised) As of June 26, 2025. Retrieved from https://www.bea.gov/news/2025/gross-domestic-product-1st-quarter-2025-third-estimate-gdp-industry-and-corporate-profits.
6 American Staffing Association. GDP Quarterly. As of June 30, 2025. Retrieved from https://americanstaffing.net/research/asa-data-dashboard/gdp-quarterly-projections/
7 FactSet. Earnings Insight. June 27, 2025
8 U.S. Bureau of Labor Statistics, Unemployment Rate [UNRATE], retrieved from FRED, Federal Reserve Bank of St. Louis;
https://fred.stlouisfed.org/series/UNRATE, July 3, 2025
9 U.S. Bureau of Economic Analysis, Personal Consumption Expenditures Excluding Food and Energy (Chain-Type Price Index) [PCEPILFE], retrieved from FRED, Federal Reserve Bank of St. Louis; https://fred.stlouisfed.org/series/PCEPILFE, July 3, 2025.
10 CME Group. CME FedWatch Too. Retrieved from https://www.cmegroup.com/markets/interest-rates/cme-fedwatch-tool.html
on July 3, 2025
11 Treasury.gov. Daily Treasury Par Yield Curve Rates. Retrieved from https://home.treasury.gov/resource-center/data-chart-center/interest-rates/TextView?type=daily_treasury_yield_curve&field_tdr_date_value=2024 on July 3, 2025
12 TradingView.com. WTI Crude Oil. Retrieved from https://www.tradingview.com/symbols/USOIL/