

Equity and Bond Markets Continue to Rally Higher in Q3
Investors enjoyed solid performance from global equity and bond markets in Q3 as the global economy and corporate earnings continued to show growth, emboldening investors to embrace risk. The S&P 500 Index returned 8.12% and the MSCI ACWI ex USA Index, which measures international developed and emerging markets stocks’ performance, returned 6.89% in Q3.1 Bonds were also strong in Q3, as higher yields continue to support total return performance. The Bloomberg U.S. Aggregate Bond Index, a multi-sector, investment grade, intermediate- term bond index, was up 2.03% in Q3, with credit-sensitive bonds generally outperforming U.S. Treasuries.1
Political Uncertainty Continues to Impact Investors
On July 4, 2025, President Trump signed the One Big Beautiful Bill Act into law, making permanent certain tax cuts originally enacted in 2017 that were set to expire, extending others and adding new tax cut provisions. While the bill was widely anticipated to pass, it removed one factor of uncertainty for investors and was generally bullish overall.
Tariffs have been a persistent factor that investors have been trying to navigate. In Q3, President Trump announced trade deals with different trade partners, but the tariffs are now being challenged by the federal courts. Investors are waiting for a ruling from the U.S. Supreme Court to determine whether the existing tariffs can remain or if changes need to be made. Investors will need to determine any potential pros (lower inflation) or cons (less tariff revenue) from the Supreme Court’s decision and any follow-through tariff legislation that Congress may need to enact.
On October 1st, the U.S. Congress failed to approve federal legislation to fund government operations. This can cause a halt in “non-essential” government activities until spending legislation is approved. Until then, government workers may be furloughed, and worker pay may be temporarily halted.
The last U.S. government “shutdown” occurred in late December 2018 and lasted for 35 days, which was a record length of time. Financial markets have historically been able to view these shutdowns as temporary, with government services resuming and worker pay ultimately restored in relatively short order. With what appears to be a deep divide between Republicans and Democrats in Congress, it is uncertain as to the potential compromises that will need to be made and how long the shutdown will last. The longer the shutdown period, the more concern investors may have, and market volatility could pick up from current sanguine levels.
U.S. Federal Reserve Cuts Interest Rates as Anticipated
On September 17th, the Federal Open Market Committee resumed its monetary easing policy and cut the fed funds rate 25 basis points (0.25%) to a target range of 4.0%-4.25% as widely expected. The FOMC last cut the fed funds rate by 25 basis points in December 2024. Fed funds futures are pricing in one or two more 25 basis point cuts before the end of the year, with the next FOMC meeting set for late October.
As shown in the following chart, FOMC members believe the fed funds rate will continue to trend lower toward 3%. With the fed funds rate currently above 3%, the Fed’s monetary policy could be viewed as restrictive, and more rate cuts could be coming.
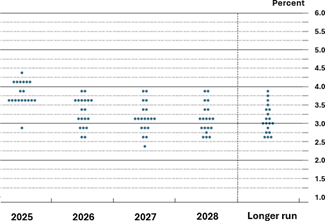
Source: U.S. Federal Reserve2
The Fed appears to have a tighter focus on the health of the jobs market and may be viewing current elevated inflation levels as transitory. Weekly jobless claims have been steadily increasing the last two years, which may be some indication of softness in the labor market. The Fed prefers to support a healthy labor market and not fall behind if the economy materially slows from this point. Although job growth has been decelerating, it has not yet had a significant negative effect on the U.S. economy.
Inflation appears somewhat anchored around 2.5-3% for now, with prices continuing to move higher for businesses and consumers without much relief. While the full effects of the tariffs have yet to fully work their way through the economy, inflation has remained steady at a persistent 2.5–3% rather than jumping significantly higher. The Personal Consumption Expenditures (PCE) Price Index is still above the Fed’s 2% target, which may continue to discourage the Fed from pursuing aggressive cuts to the fed funds rate.
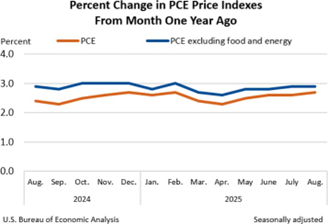
Source: U.S. Bureau of Economic Analysis
The Fed tries to manage liquidity in the economy by adjusting the fed funds rate, which is an overnight lending rate for banks. The fed funds rate can indirectly impact other interest rates, but market dynamics and bond investors can drive other consumer-related interest rates, including mortgages and other debt (auto loans, credit cards, etc.).
For consumers to feel the benefit of lower interest rates, consumers will want to see consumer-related interest rates come down from current levels and a decline in the fed funds rate will not be enough to do so alone. As shown in the following chart, mortgage and credit card rates have yet to see a material decline.
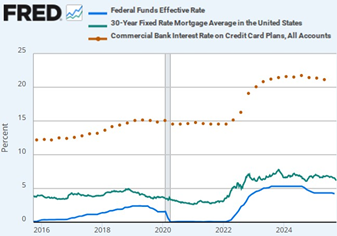
Source: FRED4, 5, 6
Moderate Economic Growth Anticipated to Continue
The U.S. economy has been resilient, with a final Q2 real GDP growth reading of 3.8%.7 Globally, the International Monetary Fund forecasts global real GDP growth of 3.1% in 2026 across advanced and emerging market economies.8 Heightened geopolitical risk remains, but a persistent moderate global growth environment could be healthy support for investors going into next year.
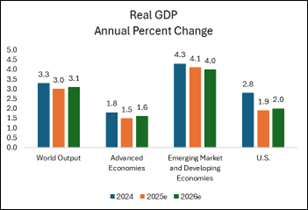
Source: International Monetary Fund8
While political rhetoric seems to be elevated and driving headlines, investors continue to focus on investment fundamentals and earnings growth as equity prices tend to follow earnings over longer periods of time. Earnings growth both within and outside the U.S. is forecasted to be strong next year. The U.S. was the bright spot in earnings growth this year, but growth may also start to accelerate internationally.
Investors position portfolios in anticipation of the future, and next year’s strong global earnings estimates may have resulted in the already strong performance for U.S. and international equities this year. If global growth can continue, investors may continue to support global equities into next year.
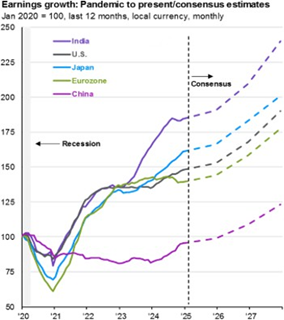
Source: JPMorgan9
Concentrated Market Cap-Weighted Index Exposure
Investors passively invested in U.S. large cap indices such as the S&P 500 and NASDAQ 100 are faced with potential concentration risk in these indices. As shown in the following chart, the S&P 500 Index’s top 10 companies in market cap now account for roughly 40% of the index. These top 10 companies include Microsoft, Apple, Alphabet (Google), Meta (Facebook), Amazon and NVIDIA, which have been strong, high-quality technology companies with stock prices that have already appreciated considerably over time.
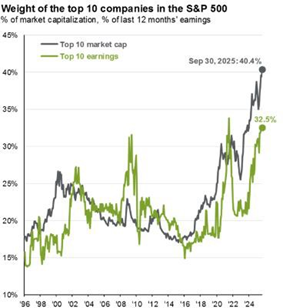
Source: JPMorgan9
While these companies’ fundamentals and stock price strength could persist, investors in the S&P 500 Index should be aware of this concentration risk and thoughtfully explore opportunities for diversification.
Q3 Market Review
Equity Markets
Global equity markets continued to rally higher in Q3 as investors embraced riskier areas of the markets. In the U.S., small caps, growth stocks, and more momentum-driven and speculative stocks generally outperformed. Outside of the U.S., emerging markets outperformed developed markets. With the U.S. economy and corporate earnings delivering growth, investors continued to support U.S. equity markets. In Q3, the S&P 500 Index rallied 8.12% and the technology-heavy NASDAQ 100 Index rallied 9.01%.1 The Russell 2000 Index, which measures the performance of smaller U.S. companies, outperformed large caps in the quarter, rallying 12.39%.1
A near-term challenge for investors is that valuations of U.S. large caps appear extended on a historical basis. The following chart shows the 12-month historical price-to-earnings ratio of the S&P 500. Current valuations are higher than their five- and 10-year historical averages, which may be a concern for valuation-conscious investors.
Given today’s higher starting valuations, investors may need to adjust their future investment return expectations lower as valuation expansion may not be a key driver of returns as they have been thus far. The chart below shows historical performance of the S&P 500 Index given its starting forward price-to-earnings ratio. At least historically and based on a current forward P/E ratio of 22.8x, subsequent 5-year annualized returns for the S&P 500 Index were muted.
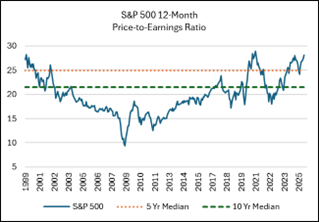
Source: Morningstar Direct10
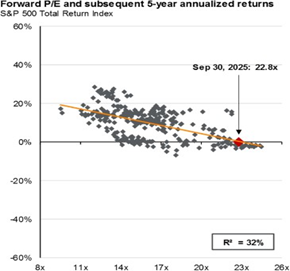
Source: JPMorgan9
Foreign equity markets also continued to show strength in the quarter. The MSCI EAFE Index, which measures the performance of developed countries’ stocks, rallied 4.77% in Q3, and is up 25.14% year-to-date through the end of the quarter.1 The MSCI Emerging Markets Index outperformed developed markets in the quarter, rallying 10.64% and is now up 27.53% year-to-date through the end of Q3.1 Year-to-date through the end of Q3, both the MSCI EAFE and MSCI Emerging Markets indices have outperformed the S&P 500 and NASDAQ 100 indices.
With global economic and corporate earnings growth anticipated to continue through next year, this backdrop could continue to drive investors to support global equities.
Bond Markets
Bonds performed well in Q3 as investors were positioned for Fed rate cuts and moderate economic growth. Bond yields shifted lower on the front end of the yield curve and credit spreads tightened in the quarter, acting as positive tailwinds for bond investors. The Bloomberg U.S. Aggregate Bond Index, an investment grade, intermediate-term bond index, returned 2.03% in the quarter.1 Investors willing to take on additional credit risk were rewarded in Q3, with the Bloomberg U.S. Corporate Investment Grade Index up 2.60% and the Bloomberg High Yield Corporate Index up 2.54%.1
Credit-sensitive bond valuations may be a bit elevated at current levels. Credit spreads have fallen substantially from the spike experienced in March and April this year and from higher levels back in 2021 and 2022 as shown in the following chart. A credit spread represents the yield difference between a bond and a risk-free bond, like U.S. Treasuries, compensating investors for taking on additional credit risk. Given current credit spreads, bond investors are being compensated less for the additional credit risk than they were in the past.
Bond investors will need to determine whether currently lower credit spreads are appropriate in this environment. With no clear signs of weakness in the U.S. economy and expectations of further rate cuts by the Federal Reserve, investors may opt to maintain credit exposure despite elevated valuations.
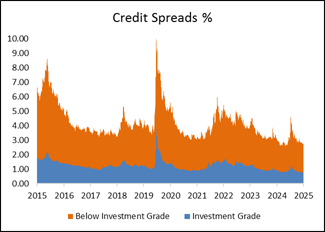
Source: FRED11, 12
Commodity Markets
Gold continued to rally to new highs in Q3, up 16.40% and approaching $4,000 per ounce. Gold is now up 44.78% year- to-date through the end of the quarter.1 Gold prices often rise in tandem with heightened uncertainty, elevated inflation, currency depreciation, and declining interest rates. Momentum can further fuel this trend, as traders and investors entering late seek to capitalize on the rally. Going forward, investors must assess whether underlying fundamentals and sustained momentum are sufficient to drive gold higher or if a potential catalyst could trigger a reversal.
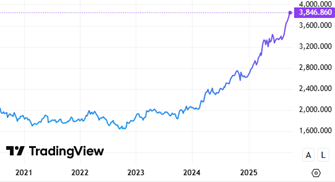
Source: TradingView13
WTI Crude Oil traded in the mid-to-low $60s per barrel in Q3, with lower price volatility than experienced in Q2. Global oil supply remains ample enough to meet demand at these levels and catalysts have not yet emerged to push oil prices materially higher or lower from this trading range. Unless there is a supply disruption or global demand increases or decreases materially, oil may continue to trade within its current range.
Currency Markets
The U.S. Dollar Index rose 0.93% in the quarter, slightly reversing its downward trend this year.1 Year-to-date through the end of Q3, the U.S. Dollar Index has declined 9.87%.1 The U.S. dollar is often driven by interest rate expectations and economic growth differentials relative to other countries. Investors will continue to navigate inflation and economic growth expectations in the U.S. relative to the rest of the world and position themselves across global currencies accordingly.
DYNAMIC PORTFOLIOS
The Dynamic models represent diversified, multi-asset portfolios that deviate from conventional ‘asset allocation’ methodology. The Dynamic strategy is optimized on a quarterly basis utilizing an ‘Expected Tail Loss’ methodology. This method isn’t solely focused on returns; rather, it seeks to achieve the most consistent, risk-adjusted performance within the investment universe available, characterized by its dynamic and adaptive approach. Utilizing advanced quantitative analysis and a risk overlay system, the Dynamic strategies aim to deliver consistent risk-adjusted returns tailored to investors’ unique risk tolerances and objectives.
Performance Review
The Dynamic models performed well during Q3, though outcomes varied across risk tolerances. The moderate portfolio achieved the highest absolute return, highlighting a bifurcation in results relative to its peers. Gold was a leading contributor, advancing to new highs on the back of renewed rate cut expectations, rising fiscal spending concerns, geopolitical tensions, and growing skepticism toward U.S. policy credibility. These themes provided both performance and diversification benefits across allocations.
Equity exposures also supported results, with technology and consumer discretionary sectors outperforming meaningfully. Technology continued to benefit from sustained capital expenditures and accelerating adoption tied to AI investment, while consumer discretionary strength reflected a rebound in risk appetite and resilient consumer spending.
The broader backdrop remained firmly risk-on, shaped by delayed tariff implementation, a pullback from austerity measures, systematic under-positioning, and growing conviction in a more accommodative policy path ahead. These dynamics favored growth- sensitive exposures, allowing the Dynamic suite to participate strongly in the quarter’s rally.
Positioning
The Dynamic portfolios increase U.S. equity exposure as risk levels rise, with early tiers holding defensive allocations such as Utilities and Staples, while higher tiers lean more heavily into growth sectors like Technology, Industrials, and Financials. Gold is also a consistent risk asset within the framework, providing diversification and acting as a hedge during periods of volatility. At the higher risk tiers, large-cap equity momentum supports a fully invested stance, complemented by allocations to mid-cap equities and selective alternatives.
On the conservative side, portfolios allocate to fixed income through core bonds and Treasuries, with greater emphasis on shorter duration exposure at lower risk levels. As portfolios shift up the risk spectrum, bond allocations gradually decline, while equity allocations increase. This balance is designed to dampen volatility at lower tiers while allowing for greater upside capture at higher tiers.
FLEXTREND PORTFOLIOS
The FlexTrend portfolios are structured to attempt to participate in the upside of persistent positive trending U.S. equity and credit markets and to protect value in persistent negative trending markets. The portfolios can significantly reduce risk and raise cash and/or conservative fixed income exposure in large market drawdowns. The portfolios are partially allocated to non-trend, defensively-managed equity and fundamentally-oriented fixed income strategies to attempt to provide further diversification. The portfolios may underperform in trendless or choppy market environments. The FlexTrend portfolios utilize mutual funds and ETFs to construct the portfolios.
Performance Review
The FlexTrend portfolios rallied in Q3 as U.S. equity and bond markets performed well. Across our long-only equity exposure, positions in the S&P 500 Index and higher quality large, mid cap and dividend growth companies positively contributed in the quarter. Our positions in tactical hedged managers also positively contributed, led by strong performance from our allocation to a trend-following manager. Our exposure to lower volatility, option-hedged equity and valuation-sensitive tactical strategies added to performance, but these strategies generally lagged the broader U.S. equity market as would be anticipated given the structurally defensive nature of those strategies. Due to the persistent uptrend in U.S. large cap equities, we remained bullish and fully invested in our tactical equity trading position throughout the quarter, which was beneficial for the FlexTrend portfolios.
Across the FlexTrend portfolios’ bond allocation, our exposure to fundamentally driven, credit-sensitive bond managers continued to add value in Q3. Our structural allocation to short-term bond managers and their shorter duration profile was a detractor as moderate duration, interest rate-sensitive bonds outperformed in Q3.
Positioning
The FlexTrend portfolios combine an allocation of core U.S. equity exposure with tactical strategies designed to manage risk. The core U.S. equity allocation is balanced across low-cost index exposure and higher-quality, growth-oriented investments. Our exposure to tactical hedged strategies remains positioned across option-based hedged equity, trend-following, and valuation-driven strategies. A portion of the equity allocation is managed dynamically to reflect medium-term market price momentum of U.S. large cap equities. At this time, U.S. large cap equity momentum remains positive, and our tactical trading position remains fully invested.
The FlexTrend portfolios remain allocated to fixed income through actively managed, fundamentally driven strategies. Our approach emphasizes managers focused on short- and intermediate-term bonds, which helps reduce interest rate sensitivity and can help to manage portfolio volatility. We believe active fixed income management has the potential to benefit the portfolios, as investment managers can take advantage of opportunities during periods of bond market volatility.
FOCUSED INCOME PORTFOLIOS
The Focused Income portfolios primarily invest in higher income-generating assets. This can include dividend-paying stocks, option- income strategies, investment grade bonds, high yield bonds, emerging markets debt and real estate securities. The portfolios’ risk exposure is not tactically managed, which can result in poor performance in weak U.S. market environments. The Focused Income portfolios utilize mutual funds and ETFs to construct the portfolios.
Performance Review
The Focused Income portfolios performed well in Q3 as global equity and bond markets rallied. U.S. large and mid cap dividend strategies were the strongest contributors in the quarter as U.S. equities generally outperformed. Exposure to international dividend growth stocks also positively contributed, but foreign developed equities underperformed the U.S. in the quarter. Exposure to option-income equity strategies was also additive in the quarter. Our allocations to multi-asset tactical income, closed-end fund and global real estate income strategies were also beneficial in the quarter.
Across the portfolios’ fixed income allocation, our exposure to credit-sensitive bond managers was beneficial as credit risk was rewarded in the quarter. Our exposure to a short-term, credit-sensitive bond manager was a positive, but its structural underweight to duration dragged on the portfolios as interest rate-sensitive bonds generally outperformed in Q3.
For our Focused Income – Ultra-Conservative portfolio, our positioning across credit-sensitive, tactical bond managers was a positive as these strategies generally outperformed core, investment grade bond indices. A structural underweight to duration was a drag on the portfolios relative to core, intermediate-term bond indices. The portfolio’s structural lack of equity exposure held the portfolio back relative to other conservative strategies with exposure to equities, as would be expected when equities outperform bonds.
Positioning
The Focused Income portfolios primarily invest in assets and strategies designed to deliver higher income. The portfolios are allocated across global dividend growth and high-dividend paying equities, option-based income managers, tactical income strategies, closed-end funds, and global real estate income. By combining these diverse sources of higher income-generating strategies, the Focused Income portfolios aim to generate attractive income streams while maintaining the potential for long-term capital appreciation.
The Focused Income portfolios continue to hold fixed income strategies with a focus on income generation through an overweight to credit exposure. We favor a mix of core and tactical managers that can actively shift credit exposure as market conditions evolve. To balance risks, the allocation is diversified across short- and intermediate-term bonds, which helps limit interest rate sensitivity while expanding the breadth of fixed income exposure.
PRESERVE & PARTICIPATE PORTFOLIOS
The Preserve & Participate models take a modern, risk-first approach to portfolio construction. Instead of traditional asset allocation, the strategy uses Q Methodology™ to optimize portfolios based on historical drawdown targets and risk-adjusted return potential. By combining equities, fixed income, and commodities through low-cost ETFs, the models aim to maximize return for each unit of risk taken—aligning with each investor’s unique risk profile.
Performance Review
The Preserve & Participate models continued to perform in alignment with their respective risk tolerances during Q3, with bro ad outperformance across allocations. The P&P 45 model led results, driven by an overweight to technology and gold, both of which materially outpaced broader indices. Technology strength was supported by easing macro conditions, steady capital expenditure trends, and the ongoing AI cycle. Gold also moved higher in parabolic fashion, fueled by expectations for renewed rate cuts, concerns over fiscal discipline, geopolitical tensions, and weakening administrative credibility. These exposures provided meaningful upside across the models.
That said, with the risk-on run that defined the summer, some safe-haven sectors and assets served as detractors across risk tolerances. Defensive allocations such as consumer staples and bonds lagged the broader rally, limiting upside in models with heavier exposure to these areas. Overall, results reflected a market driven by momentum, policy expectations, and concentrated leadership in growth and commodities. Aggressive allocations captured the most upside, while even the more conservative sleeves participated meaningfully despite drag from their defensive tilts.
Positioning
The Preserve & Participate models saw several notable adjustments during August. Technology exposure increased in P&P 30 and P&P 45, with additional allocations to communication services and energy in P&P 30. Utilities were also introduced in P&P 30, adding a defensive tilt. At the same time, consumer discretionary was pared back in both P&P 30 and P&P 45. Gold was trimmed across most allocations, though exposure was increased in P&P 60.
Changes within conservative allocations highlighted differing views on duration. P&P 5 rotated out of long Treasuries in favor of more core bond exposure, while P&P 10 extended duration with increased intermediate allocations. P&P 20 modestly raised longer- duration exposure, and P&P 45 added longer-duration assets, marking a meaningful shift in positioning.
TOTAL RETURN/TOTAL RETURN ETF PORTFOLIOS
The Total Return and Total Return ETF portfolios provide long-term diversified exposure across U.S. and international equities, bonds and income-generating assets. The portfolios are structured to participate in the upside of bullish equity and credit markets and provide moderate income generation. The portfolios’ risk exposure is not tactically managed and can result in poor performance in weak market environments. The Total Return portfolios utilize mutual funds and ETFs to construct the portfolios, while the Total Return ETF portfolios only utilize ETFs to construct the portfolios.
Performance Review
The Total Return portfolios performed well in Q3 as global equities, multi-asset income strategies and bonds rallied. Our exposure to U.S. large and small cap equities was beneficial as these areas outperformed in Q3. Exposure to U.S. mid cap growth stocks was a positive, but this position lagged other areas of the U.S. equity market in the quarter. Dedicated exposures to international small caps and emerging markets were also strong positive contributors in Q3. Our allocations to higher quality companies in foreign developed markets and active global equity managers were positive contributors in the quarter, but these exposures generally underperformed U.S. large cap equities in the quarter. Exposures to multi-asset income and closed-end fund strategies were also positive contributors in Q3, but these areas underperformed pure global equity exposure in the quarter.
In the Total Return taxable bond allocation, our exposure to actively managed bond strategies added value as these managers’ overweights to credit-sensitive bonds were rewarded during the risk-on rally in Q3. In the Total Return Muni bond manager allocations, the managers’ overweight to credit was roughly neutral for performance, but their aggregate underweight to duration dragged on performance as interest rate-sensitive munis generally outperformed.
Positioning
The Total Return portfolios maintain a diversified blend of U.S. and international equities alongside income-generating investments. Equity exposure is distributed across U.S. and international regions, market cap and investment styles to promote broad diversification. Income allocations focus on multi-asset strategies, blending dividend-paying equities, credit-sensitive bonds, option- based income, and closed-end funds across our positions. To balance cost efficiency with the potential for added value, the portfolios draw on a mix of active managers and index-based strategies.
The Total Return portfolios continue to invest in actively managed fixed income strategies. We balance allocations between core, high-quality investment grade managers and more flexible, tactical bond approaches that can adjust to changing market conditions. We believe this combination offers the expertise and adaptability necessary to navigate an evolving fixed income environment.
U.S. CORE/U.S. CORE ETF PORTFOLIOS
The U.S. Core and U.S. Core ETF portfolios provide long-term exposure to core U.S. equity and bond markets. The portfolios may have some exposure to non-core markets, including foreign assets and lower-quality fixed income. The portfolios are structured to participate in the upside of bullish U.S. equity and credit markets. The portfolios’ risk exposure is not tactically managed and can result in poor performance in weak U.S. market environments. The U.S. Core portfolios utilize mutual funds and ETFs to construct the portfolios, while the U.S. Core ETF portfolios only utilize ETFs to construct the portfolios.
Performance Review
The U.S. Core portfolios performed well in Q3 as U.S. equities and bonds rallied. Our strongest contribution to performance in Q3 was our dedicated exposure to higher quality, small cap company stocks. Exposure to the passive S&P 500 Index, higher quality growth and dividend growth strategies were also strong contributors in the quarter. Our exposure to mid cap stocks was a positive contribution, but mid caps generally underperformed large and small cap stocks in Q3. Exposure to value stocks was somewhat mixed in the quarter.
In the U.S. Core portfolios’ taxable bond allocation, our exposure to actively managed bond strategies was a positive contributor as these managers’ overweights to credit-sensitive bonds were rewarded as riskier bonds outperformed. In our U.S. Core Muni bond allocations, bond managers’ underweight to duration was a bit of a drag on the quarter as interest rate-sensitive bonds generally outperformed.
Positioning
The U.S. Core portfolios provide broad U.S. equity exposure through a combination of market cap-weighted indices, fundamentally weighted indices, and actively managed strategies. Our approach emphasizes diversification across both investment styles and company sizes, with a focus on higher-quality businesses that exhibit consistent growth potential.
The U.S. Core portfolios hold a combination of traditional core investment grade bond strategies and more opportunistic, flexible strategies. Core bonds are emphasized in the portfolios for their potential to offer downside protection during periods of equity market stress. We allocate to tactical bond managers that have the potential to capitalize in periods of dislocation across the bond markets.
CONCENTRATED GROWTH SMA PORTFOLIOS
The Concentrated Growth SMA is a focused portfolio of ~40 U.S. large- and mid-cap stocks selected for high returns on invested capital (ROIC), strong profitability, and reinvestment potential. Using a systematic, quarterly ranking process and a cyclically adjusted ROE screen, the strategy targets companies with scalable business models and long-term growth prospects. Direct security ownership helps minimize fees and improve long-term outcomes.
Performance Review
The Concentrated Growth SMA experienced an underwhelming quarter, underperforming the broader market despite several standout successes. Notable winners included AbbVie (ABBV), Apple (AAPL), Brink’s Company (BCO), NVIDIA (NVDA), and O’Reilly Automotive (ORLY), all of which delivered strong gains and showcased the portfolio’s ability to identify companies with durable growth drivers and favorable market dynamics.
However, the portfolio’s overall composition weighed on relative results, as significant detractors such as FactSet (FDS), Fortinet (FTNT), Fair Isaac (FICO), and Netflix (NFLX) offset much of the strength from top contributors. These headwinds limited the strategy’s ability to fully participate in the quarter’s broader equity rally. We remain committed to our disciplined approach, emphasizing businesses with high returns on capital and sustainable profitability. While near-term performance was challenged by portfolio-specific headwinds, we believe this framework positions the strategy well to capture value over the long term in an evolving market environment.
Positioning
AAPL, ABBV, ADP, AMP, AN, BCO, BKNG, BLDR, BMY, CAH, COKE, COR, CSL, DECK, DKS, DPZ, EXP, FDS, FICO, FTNT, JBL, LECO, LII, MA, MANH, MCK, MTD, NEU, NFLX, NTAP, NVDA, OMC, ORLY, OTIS, QLYS, SCI, TREX, TXRH, WSM, YUM
MOAT SMA PORTFOLIOS
The MOAT SMA invests in U.S. large-cap companies with durable competitive advantages, or “economic moats,” such as brand strength, cost efficiency, or regulatory barriers. Leveraging Morningstar’s moat ratings and fundamental valuation methods, the strategy seeks to build a risk-aware, long-term growth portfolio focused on capital preservation and consistent outperformance relative to broad market indices.
Performance Review
The MOAT SMA delivered respectable absolute return in Q3, though it slightly underperformed the broader market. This was expected in a quarter where momentum-driven leadership once again dominated, led by high-multiple technology and growth names. Despite this, the portfolio showcased several standout performers. Teradyne (TER) led results with an impressive return of nearly 60% in Q3, while Alphabet (GOOGL) and Monolithic Power Systems (MPWR) also contributed meaningfully to gains. These results highlight the benefits of the strategy’s focus on companies with durable competitive advantages and strong fundamental positioning.
Relative performance was tempered by weakness in consumer staples and other defensive holdings, which lagged in a risk -on environment, as well as established software names like Adobe and Synopsys that were overshadowed by mega-cap AI leaders. These factor exposures limited upside during the quarter but remain consistent with the portfolio’s disciplined approach. While this positioning can cause the strategy to trail in surging, sentiment-driven markets, it also enhances downside protection and promotes long-term consistency—hallmarks of a true moat-based philosophy. We remain confident in the long-term value of this discipline and will continue to prioritize quality, sustainability, and risk-aware investing.
Positioning
A, ADBE, ADSK, ALLE, AMAT, AMGN, AMZN, BA, BFB, BMY, CAT, CDNS, CLX, CPB, CRM, CTVA, DHR, DIS, EL, GEHC, GOOGL, HII, HSY, IEX, IFF, KVUE, LRCX, MANH, MAS, MCHP, MDLZ, MKTX, MPWR, MRK, MSFT, NDSN, NKE, NOC, NXPI, ORCL, PEP, PFE, SCHW, SNPS, STZ, TER, TMO, TRU, UPS, USB, VEEV, WDAY, WST, ZBH
QUALITY DIVIDEND SMA PORTFOLIOS
The Quality Dividend SMA targets financially strong U.S. large-cap companies with a history of stable and growing dividends. Rather than chasing high yields, the strategy emphasizes balance sheet strength, earnings consistency, and dividend coverage, selecting the top dividend growers in each sector. This results in a diversified, lower-volatility portfolio built for income and long-term growth.
Performance Review
The Quality Dividend SMA outperformed its benchmark in Q3, a strong showing in a quarter where dividend-focused strategies generally lagged in a broad risk-on environment. Despite factor headwinds, the portfolio delivered competitive results, supported by strong performances from Johnson & Johnson (JNJ), Sempra (SRE), Best Buy (BBY), and TJX Companies (TJX).
Importantly, performance was broad-based, with 10 of the 33 holdings generating returns over 10% during the quarter. This breadth highlights the resilience of the portfolio’s diversified exposure across high-quality, dividend-paying names, even as market leadership remained narrow in parts of the broader equity market. We remain confident in the strategy’s positioning, emphasizing dividend consistency, balance sheet strength, and defensive characteristics that can help manage volatility while participating meaningfully in equity upside.
Positioning
ADM, APD, ATO, AVB, AWK, BBY, CMCSA, CSCO, CVX, EOG, EXR, IPG, JNJ, KMB, LIN, LMT, MDT, MS, OMC, PEP, PFE, PPG, QCOM, REG, RF, RL, SNA, SRE, SWK, TJX, TXN, USB, XOM
Resources
1 Morningstar Performance provided as total returns. U.S. Mid Caps is defined by the Russell Mid Cap TR USD index. U.S. Small Caps is defined by the Russell 2000 TR USD index. U.S. Growth is defined by the Russell 3000 Growth TR USD index. U.S. Value is defined by the Russell 3000 Value TR USD index. International Developed is defined by the MSCI EAFE NR USD index. Emerging Markets is defined by the MSCI Emerging Markets NR USD index. U.S. Agg Bond is defined by the Bloomberg U.S. Aggregate Bond TR USD index. U.S. Investment Grade Corp is defined by the Bloomberg U.S. Corporate Investment Grade TR USD Index. U.S. High Yield is defined by the Bloomberg High Yield Corporate TR USD index. Broad Commodities is defined by the Bloomberg Commodity TR USD index. WTI Crude Oil is defined by the Bloomberg Sub WTI Crude Oil TR USD Index. Gold is defined by the Bloomberg Sub Gold TR USD Index. Industrial Metals is defined by the Bloomberg Sub Industrial Metals TR USD Index. Short-Term Treasuries defined by the Bloomberg 1-3 Yr U.S. Treasury TR USD index. Intermediate-Term Treasuries defined by the Bloomberg Intermediate U.S. Treasury TR USD Index. Long-Term Treasuries defined by the Bloomberg Long- Term U.S. Treasury TR USD Index.
2 Federal Open Market Committee. Summary of Economic Projections. September 17, 2025.
3 U.S. Bureau of Economic Analysis. Personal Income and Outlays, August 2025. Retrieved from https://www.bea.gov/news/2025/personal-income-and-outlays-august-2025
4 Board of Governors of the Federal Reserve System (US), Federal Funds Effective Rate [FEDFUNDS], retrieved from FRED, Federal Reserve Bank of St. Louis; https://fred.stlouisfed.org/series/FEDFUNDS, September 2025
5 Freddie Mac, 30-Year Fixed Rate Mortgage Average in the United States [MORTGAGE30US], retrieved from FRED, Federal Reserve Bank of St. Louis; https://fred.stlouisfed.org/series/MORTGAGE30US, September 25, 2025
6 Board of Governors of the Federal Reserve System (US), Commercial Bank Interest Rate on Credit Card Plans, All Accounts [TERMCBCCALLNS], retrieved from FRED, Federal Reserve Bank of St. Louis; https://fred.stlouisfed.org/series/TERMCBCCALLNS, May 2025.
7 U.S. Bureau of Economic Analysis. Gross Domestic Product, 2nd Quarter 2025 (Third Estimate), GDP by Industry, Corporate Profits (Revised), and Annual Update. Retrieved from https://www.bea.gov/news/2025/gross-domestic-product-2nd-quarter-2025-third-estimate-gdp-industry-corporate-profits
8 International Monetary Fund. IMF World Economic Outlook July 2025. Retrieved from https://www.imf.org/en/Publications/WEO/Issues/2025/07/29/world-economic-outlook-update-july-2025
9 JPMorgan. 4Q 2025 Guide to the Markets. September 30, 2025.
10 Morningstar Direct. S&P 500 12-Month Trailing Price-to-Earnings Ratio. As of November 1999 – September 2025.
11 Ice Data Indices, LLC, ICE BofA US Corporate Index Option-Adjusted Spread [BAMLC0A0CM], retrieved from FRED, Federal Reserve Bank of St. Louis; https://fred.stlouisfed.org/series/BAMLC0A0CM.
12 Ice Data Indices, LLC, ICE BofA US High Yield Index Option-Adjusted Spread [BAMLH0A0HYM2], retrieved from FRED, Federal Reserve Bank of St. Louis; https://fred.stlouisfed.org/series/BAMLH0A0HYM2.
13 TradingView.com. Gold. Retrieved from https://www.tradingview.com/chart/?symbol=TVC%3AGOLD as of September 30, 2025.