

Diversified Global Investors Were
Rewarded in Q4 and 2025
Diversified global investors were rewarded in Q4 and throughout 2025. The year witnessed a significant shift where foreign equities outperformed domestic markets, precious metals outperformed equities, and the U.S. dollar weakened against foreign currencies.
In the U.S., the S&P 500 Index rose 2.66% in Q4 and 17.88% for the year. Foreign equity markets displayed even stronger performance, as the MSCI ACWI ex USA Index gained 5.05% in the quarter and surged 32.39% in 2025. Bonds also delivered solid returns as the Bloomberg U.S. Aggregate Bond Index returned 1.10% for the quarter and 7.30% for the full year.1
One of the most surprising and strongest-performing asset classes was precious metals. The Bloomberg Gold Subindex rallied 12.22% in the quarter and 62.46% for the year. Silver outperformed gold as the Bloomberg Silver Subindex rallied 50.96% in Q4 for a significant 138.63% return in 2025.1
Speculative momentum in 2025 at least partially drove significant asset appreciation across artificial intelligence and precious metals, and through risk-taking in unprofitable companies. Investors may need to exercise greater selectivity in 2026 as this speculative froth could fade and require a renewed focus on fundamentals.
The investment landscape for 2026 continues to be defined by resilience and the Fed’s monetary transition. We have moved from an era of combating high inflation with Fed tightening to a period of moderate inflation and normalized interest rates. This shift is supported by an underlying economy that remains fundamentally strong. Financial markets could continue to reward investors if the strong economic environment can persist throughout the new year.
U.S. Economic Strength Continues
The U.S. economy continues to show strength as the initial Q3 Real GDP growth estimate measured 4.3%. Key drivers included resilient consumer activity, exports and government spending. While business investment in artificial intelligence provided a major boost, private investment in manufacturing and wholesale trade lagged. A decline in imports further benefited the strong GDP number for Q3.2
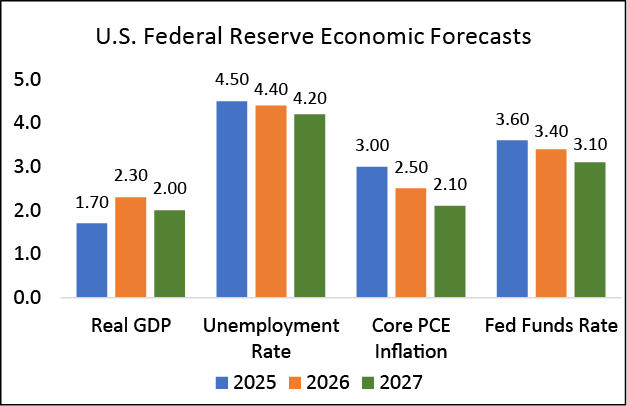
Source: Federal Reserve. Median Forecasts as of 12/20/25.3
The recent rally in financial markets can also have a meaningful wealth effect by strengthening household balance sheets. This primarily benefits middle- and upper-income households that
hold financial assets. As net worth expands, these consumers feel empowered to sustain discretionary spending regardless of volatility in other economic sectors.
This wealth-supported consumption can act as a stabilizer for the broader economy and support corporate earnings. Resilient economic growth and controlled inflation could provide a constructive backdrop for financial markets in 2026.
If economic growth results in inflation above the Federal Reserve’s 2% long-term target, the Fed could keep the fed funds rate higher for longer. We did not see a sustained downtrend in inflation throughout 2025. Inflation has remained within the 2.5%-3.5% range, which has been persistently above the Fed’s 2% target.
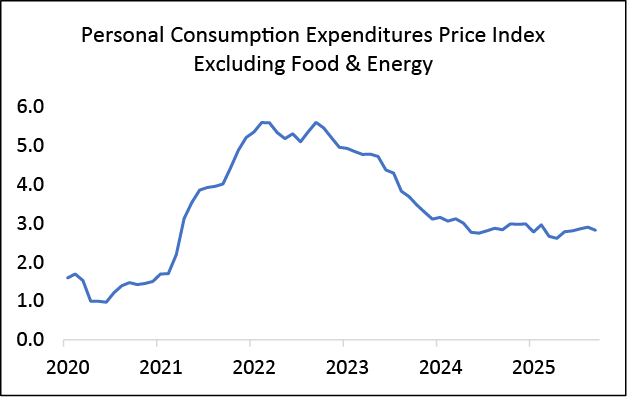
Source: U.S. Bureau of Economic Analysis. FRED. Sep 2025.4
Although economic growth is anticipated to persist, the Federal Reserve forecasts diminishing inflation pressures throughout 2026 and 2027. If the data aligns with these projections, the Fed
could resume cutting interest rates at some point in 2026.
Policy Uncertainty and Political Risks
In Q4, the U.S. government endured a 43-day shutdown, which marks the longest in history. Although this did not materially damage the economy or the financial markets, partisan conflict has not abated and remains a key risk factor for 2026.
The One Big Beautiful Bill Act passed in 2025 was designed to stimulate economic activity through tax cuts and accelerated business investment incentives. This legislation could be a powerful tailwind for consumers and businesses that supports durable economic expansion and strong corporate earnings growth.
Washington’s failure to renew Affordable Care Act health insurance premium subsidies may trigger a sharp rise in premiums that effectively reduces disposable income for millions of households. This surge in added expenses could act as a drag on discretionary spending power.
If these subsidies are not extended or legislation is not passed to curb insurance premium
costs, softer consumer spending could negatively weigh on the economy, corporate earnings, and ultimately the financial markets.
This political shift could trigger market volatility if investors begin pricing in a less favorable corporate environment should Republicans lose the majority leadership in Congress.
Trade tariffs remain a complex factor for investors to navigate in 2026. The Supreme Court is expected to rule on whether President Trump’s tariffs are legal as currently implemented. If they are revoked, market volatility could pick up again. The White House may need to restructure the tariffs under different statutes and adjust accordingly.
This persistent trade unpredictability could force companies to remain cautious with business planning and might delay economic activity. The November midterm elections will likely dominate financial headlines in 2026. Markets historically exhibit volatility in the months leading up to the vote due to heightened policy uncertainty.
Investors often view divided government favorably because legislative gridlock prevents drastic changes that disrupt business conditions. Current political projections suggest Democrats may gain a majority in the House of Representatives while the Republicans retain the Senate.
This political shift could trigger market volatility if investors begin pricing in a less favorable corporate environment should Republicans lose the majority leadership in Congress.
Monetary Policy: The Fed and the Yield Curve
As was widely anticipated, the Federal Reserve lowered the fed funds rate target range by 25 basis points (0.25%) to 3.50%-3.75% in December. This marked a total reduction of 75 basis points in the fed funds rate for the year, following similar reductions in September and October.
Fed policymakers signaled that rate cuts might be on hold for now as economic growth appears durable and inflation is projected to moderate further. Financial markets are pricing in between one and three additional rate cuts in 2026. This suggests that while the easing cycle has continued, the Fed will likely proceed with caution from here.
The Fed will continue monitoring the labor market for signs of material weakness. The U.S. job market remains in a “low hire, low fire” environment. The U.S. unemployment rate of 4.4% measured in December remains at the lower end of its long-term historical range.
Fiscal debt concerns remain a persistent headwind for the economy. Federal leverage is high and accelerating, representing a structural issue that markets cannot ignore indefinitely.
The Department of Government Efficiency (DOGE), established in early 2025 with a mandate to reduce federal spending and improve operational efficiency, no longer appears to be a priority for President Trump’s administration. The U.S. government’s debt is a long-term anchor that could drag on growth if bond vigilantes demand significantly higher yields.
If U.S. debt levels continue to expand, interest rates along the yield curve may fail to reach sustainably lower levels from here.
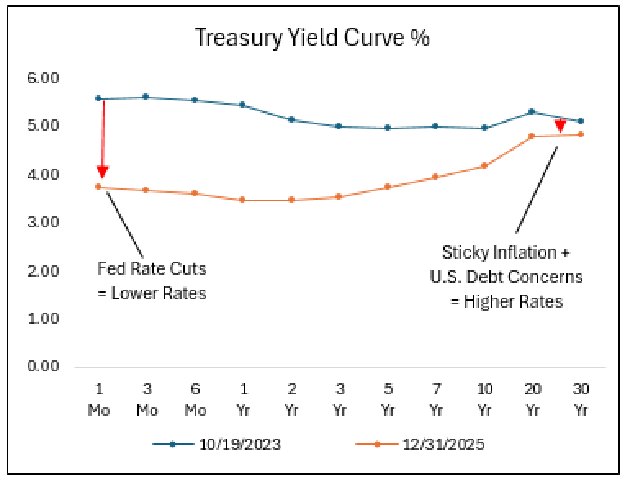
Source: U.S. Department of the Treasury.6
To continue reading our Quarterly Investment Commentary, click the image or button below.
SOURCES
1 Morningstar Direct. Performance provided as total returns. U.S. Mid Caps is defined by the Russell Mid Cap TR USD index. U.S. Small Caps is defined by the Russell 2000 TR USD index. U.S. Growth is defined by the Russell 3000 Growth TR USD index. U.S. Value is defined by the Russell 3000 Value TR USD index. International Developed is defined by the MSCI EAFE NR USD index. Emerging Markets is defined by the MSCI Emerging Markets NR USD index. U.S. Agg Bond is defined by the Bloomberg U.S. Aggregate Bond TR USD index. U.S. Investment Grade Corp is defined by the Bloomberg U.S. Corporate Investment Grade TR USD Index. U.S. High Yield is defined by the Bloomberg High Yield Corporate TR USD index. Broad Commodities is defined by the Bloomberg Commodity TR USD index. WTI Crude Oil is defined by the Bloomberg Sub WTI Crude Oil TR USD Index. Gold is defined by the Bloomberg Sub Gold TR USD Index. Industrial Metals is defined by the Bloomberg Sub Industrial Metals TR USD Index. Short-Term Treasuries defined by the Bloomberg 1-3 Yr U.S. Treasury TR USD index. Intermediate-Term Treasuries defined by the Bloomberg Intermediate U.S. Treasury TR USD Index. Long-Term Treasuries defined by the Bloomberg Long-Term U.S. Treasury TR USD Index.
2 U.S. Bureau of Economic Analysis. Gross Domestic Product, 3rd Quarter 2025 (Initial Estimate) and Corporate Profits (Preliminary). 12/23/25. Retrieved from https://www.bea.gov/news/2025/gross-domestic-product-3rd-quarter-2025-initial-estimate-and-corporate-profits
3 U.S. Federal Reserve. Federal Open Market Committee Economic Projections. 12/10/25. Retrieved from https://www.federalreserve.gov/monetarypolicy/fomcprojtabl20251210.htm#xt1p1f4
4 U.S. Bureau of Economic Analysis, Personal Consumption Expenditures Excluding Food and Energy (Chain-Type Price Index) [PCEPILFE], retrieved from FRED, Federal Reserve Bank of St. Louis; https://fred.stlouisfed.org/series/PCEPILFE, January 6, 2026.
6 U.S. Department of the Treasury. Daily Treasury Rates. Retrieved from home.treasury.gov.