


Oil Spikes, Interest Rates Shift Higher, Equities Mixed
Throughout Q3 2026, rebounding energy prices and higher interest rates pressured broader financial markets. The escalating conflict in Iran drove increases across crude and
refined fuels, raising concerns that these input costs could contribute to additional inflation, negatively impacting consumers and businesses.
Faced with renewed inflationary pressures, the Federal Reserve, led by new Fed Chair Kevin Warsh, responded by raising the federal funds rate by 25 basis points (0.25%) in September to a target range of 3.75% to 4.00%. The Fed continued to signal its commitment to anchoring long-term inflation expectations.
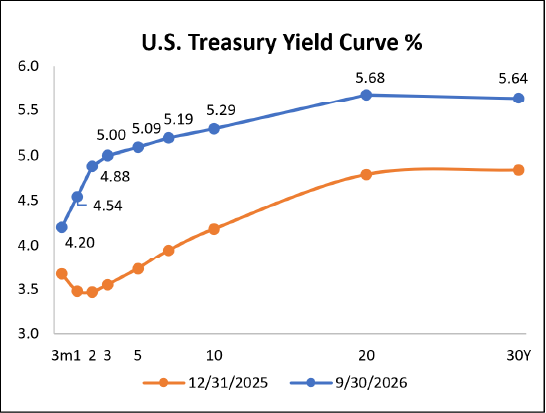
As inflation remained sticky, U.S. Treasury yields pushed higher across the curve as bond investors repriced the market, placing downward pressure on interest rate-sensitive bonds. The heavily watched U.S. 10-year Treasury yield climbed above 5.0% to trade near 5.35%, at levels not seen since 2002. A heavy surge in corporate bond issuance this year, coupled with total U.S.
government debt eclipsing $40 trillion, compounded supply-side pressures across bond markets. These elevated yields could tighten financial conditions for consumers and corporate borrowers alike.
Source: Treasury.gov2
Against a backdrop of rising energy costs and elevated interest rates, equity markets delivered mixed performance in Q3. While the S&P 500 gained 2.30% and the technology-heavy Nasdaq 100 moved 0.58% higher, these headline returns masked significant underlying volatility.1 Cyclical and rate-sensitive sectors bore the brunt of the pressure, as capital rotated back into secular AI buildout beneficiaries and cash-rich balance sheets better
insulated from macroeconomic headwinds.
Fed Balances Inflation Fight with Employment Stability
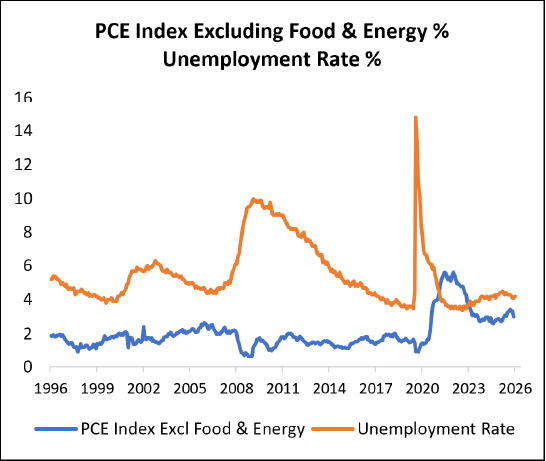
The Federal Reserve remains focused on its dual mandate of price stability and maximum employment to chart the course for monetary policy. While the more well-known Consumer Price Index (CPI) captures headline household costs, policymakers rely heavily on the Core Personal Consumption Expenditures (PCE) Index, which strips out volatile food and energy, to gauge structural inflation trends and calibrate the trajectory of benchmark interest rates.
As illustrated in the following chart, the Core PCE Index continues to run persistently above the Fed’s 2% long-term inflation target, while unemployment sits near the lower boundary of its 20-year range. With the labor market remaining fundamentally sound, policymakers could retain the flexibility to prioritize price stability over near-term employment support.
Source: FRED3
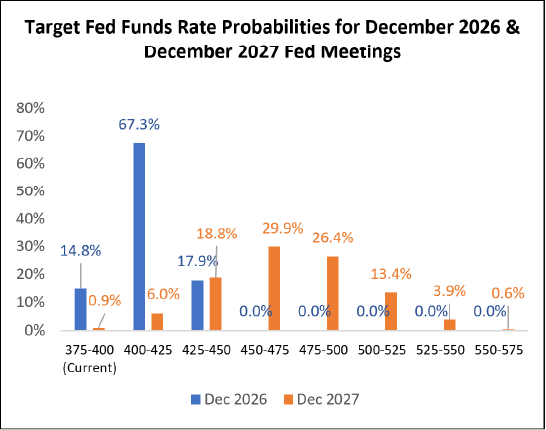
Amid persistent inflation, and even following the Fed’s 25 basis point rate hike in September, financial markets are pricing in one to two additional 25 basis point hikes before year-end, with the potential for further rate hikes in 2027. Investors continue monitoring incoming data closely to gauge whether sustained economic momentum could prompt further Federal Reserve rate hikes and how those moves might affect various asset classes.
Source: CME Group4 as of 10/3/26
We continue to see strength in U.S. manufacturing and services sectors, with September Purchasing Managers’ Index (PMI) readings of 54.5 (manufacturing) and 54.9 (services) reflecting economic expansion.
Wholesale Inflation Threatens Consumer Budgets
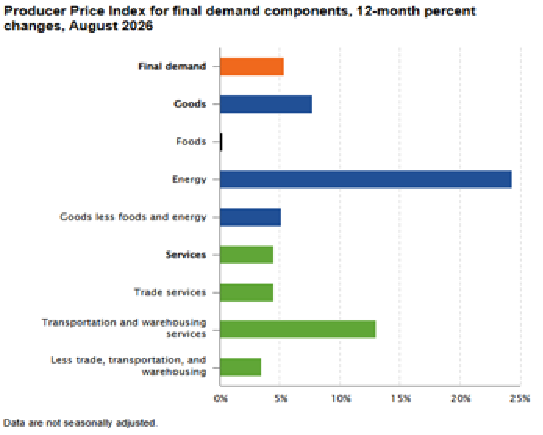
Inflation continues to challenge the corporate sector, where margin pressures typically emerge before hitting household budgets. Over the 12 months ending August 2026, the Producer Price Index rose 5.4%, signaling persistent wholesale cost acceleration.5 Surging energy costs served as the primary catalyst, while food prices remained relatively flat. Within services, price pressures stayed elevated, led by transportation and warehousing, where higher diesel fuel costs fed into freight and distribution services.
Source: U.S. Bureau of Labor Statistics5
Because businesses often find it difficult to absorb prolonged input cost increases, many companies look to pass a portion of these expenses downstream to end users. As a result, persistent strength across wholesale goods and services points to continued upward pressure on upcoming Consumer Price Index (CPI) readings, potentially threatening to squeeze household purchasing power in the months ahead.
Stable U.S. Economic Growth Amid Higher Rates, For Now
U.S. economic growth is projected to hold relatively steady heading into 2027, with Wall Street Journal survey economists forecasting Real GDP between 2.0% and 2.5%.6 Yet much like the equity markets, headline stability masks underlying divergence as interest rate-sensitive sectors, particularly consumer discretionary and real estate, remain vulnerable to a higher-for-longer interest rate environment.
We continue to see strength in U.S. manufacturing and services sectors, with September Purchasing Managers’ Index (PMI) readings of 54.5 (manufacturing) and 54.9 (services) reflecting economic expansion. Although headline PMI readings indicate solid expansion, price subindices of 77.9 in manufacturing and 74.0 in services highlight persistent inflationary pressures spreading across the broader economy.7
U.S. corporate earnings continue to show notable strength, with consensus forecasts targeting over 30% S&P 500 EPS growth in 2026 and double-digit gains into 2027.8 Even after accounting for typical downward revisions as forecasts mature, these elevated profit expectations could provide support for U.S. equities heading into next year.
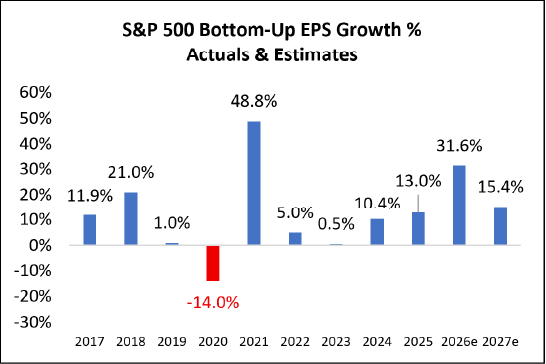
Source: FactSet8
Markets are closely watching the conflict in Iran for supply-driven oil spikes that could reignite inflation and keep interest rates higher for longer. Higher borrowing costs risk curbing consumer and business spending, slowing U.S. economic momentum, and creating potential headwinds for corporate profitability and the financial markets.
Navigating Markets as Midterm Elections Near
As news headlines shift some focus toward the upcoming midterm elections, consensus forecasts point to Democrats potentially reclaiming the House majority, while the Senate appears closely contested. Historically, financial markets have generally favored a divided government. Political gridlock often acts as a natural check against sweeping fiscal overhauls and aggressive policy changes, fostering a more predictable tax and regulatory environment for consumers and businesses.
For long-term investors, investment fundamentals like earnings power, balance sheet strength, and cash flow generation often drive investment performance more than the short-term noise of Washington politics.
To continue reading our Q3 2026 Quarterly Investment Commentary, click the image or button below.
SOURCES
1 Morningstar Direct. Performance provided as total returns. U.S. Mid Caps is defined by the Russell Mid Cap TR USD index. U.S. Small Caps is defined by the Russell 2000 TR USD index. U.S. Growth is defined by the Russell 3000 Growth TR USD index. U.S. Value is defined by the Russell 3000 Value TR USD index. International Developed is defined by the MSCI EAFE NR USD index. Emerging Markets is defined by the MSCI Emerging Markets NR USD index. U.S. Agg Bond is defined by the Bloomberg U.S. Aggregate Bond TR USD index. U.S. Investment Grade Corp is defined by the Bloomberg U.S. IG Corp USD 300 M TR USD Index. U.S. High Yield is defined by the Bloomberg High Yield Corporate TR USD index. Broad Commodities is defined by the Bloomberg Commodity TR USD index. WTI Crude Oil is defined by the Bloomberg Sub WTI Crude Oil TR USD Index. Gold is defined by the Bloomberg Sub Gold TR USD Index. Industrial Metals is defined by the Bloomberg Sub Industrial Metals TR USD Index. Short-Term Treasuries defined by the Bloomberg 1-3 Yr U.S. Treasury TR USD index. Intermediate-Term Treasuries defined by the Bloomberg Intermediate U.S. Treasury TR USD Index. Long-Term Treasuries defined by the Bloomberg Long-Term U.S. Treasury TR USD Index.
2 U.S. Treasury. Daily Treasury Par Yield Curve Rates https://home.treasury.gov/resource-center/data-chart-center/interest-rates/TextView?type=daily_treasury_bill_rates&field_tdr_date_value=2026
3 Source: FRED. U.S. Bureau of Economic Analysis, Personal Consumption Expenditures Excluding Food and Energy (Chain-Type Price Index) [PCEPILFE], retrieved from FRED, Federal Reserve Bank of St. Louis; https://fred.stlouisfed.org/series/PCEPILFE, .. U.S. Bureau of Labor Statistics, Unemployment Rate [UNRATE], retrieved from FRED, Federal Reserve Bank of St. Louis; https://fred.stlouisfed.org/series/UNRATE
4 CME Group. FedWatch Tool. Retrieved 10/3/26 from https://www.cmegroup.com/markets/interest-rates/cme-fedwatch-tool.html
5 U.S. Bureau of Labor Statistics. Producer Price Index for Final Demand Components. September 16, 2026. Retrieved from https://www.bls.gov/opub/ted/2026/producer-price-index-up-5-4-percent-for-the-12-months-ended-august-2026.htm
6 American Staffing Association. GDP Quarterly. Retrieved from https://americanstaffing.net/research/asa-data-dashboard/gdp-quarterly-projections/
7 Institute for Supply Management. September Manufacturing and Services PMIs. https://www.ismworld.org/supply-management-news-and-reports/reports/ism-pmi-reports/services/september/
8 FactSet. Earnings Insight. 9/28/26
9 FactSet. S&P 500 Index Forward 12-Month Price-to-Earnings Ratio. 9/30/26.
10 TradingView.com. 10-Year Treasury Yield. 30-Year Treasury Yield. As of 10/8/26.
11 U.S. Energy Information Administration, US Diesel Sales Price [GASDESW], retrieved from FRED, Federal Reserve Bank of St. Louis; https://fred.stlouisfed.org/series/GASDESW
12 TradingView.com. WTI Crude Oil. Retrieved from https://www.tradingview.com/chart/S5oI8Odc/?symbol=TVC%3AUSOIL
13 TradingView.com. Gold. Retrieved from https://www.tradingview.com/chart/S5oI8Odc/?symbol=TVC%3AGOLD