


Equities and Bonds Rally, Oil Declines in Q2
In the second quarter, global equity and credit markets rebounded from first-quarter weakness as the U.S.-Iran conflict transitioned into a series of intermittent ceasefires and ongoing attempts at de-escalation. President Trump’s initial ceasefire announcement on April 7 sparked a risk-on environment that persisted throughout the quarter.
In Q2, the S&P 500 Index rallied 15.20%, while the technology-heavy NASDAQ 100 Index posted a 27.74% gain.1 Investors continued to show their appetite for investments related to artificial intelligence, propelling AI-related stocks significantly higher in the quarter.
With the potential for de-escalation in the Middle East, energy prices have declined significantly from their recent peaks as the worst fears of supply disruption have eased. West Texas Intermediate crude oil fell from a high of approximately $120 per barrel in early March to below $70 per barrel in late June, but the situation remains fragile.
This steep drop in energy prices served as a catalyst for the broader financial markets. Cheaper oil can directly translate to lower transportation and input costs for businesses while providing relief to consumers at the gas pump. This easing of lingering inflationary pressures helped push interest rates lower from their highs and added to the bullishness in equities. For the time being, investors may remain focused on the underlying strength of the global economy and corporate fundamentals.
Economic Stability but Inflation Pressures Persist
From a fundamental perspective, a resilient U.S. economy paired with strong corporate earnings growth continues to support bullish momentum in equities. According to FactSet, analysts project over 20% year-over-year earnings growth for the S&P 500 Index this year and continued growth into 2027.2
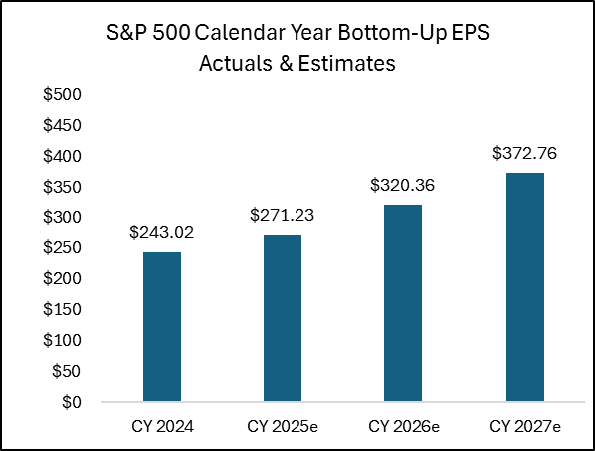
Source: FactSet2
Recent macroeconomic data shows resilience in the U.S. economy. Based on the June 2026 Purchasing Managers’ Index reports from the Institute for Supply Management, both the U.S. manufacturing and services sectors remain in expansion territory, with readings of 53.3 and 54.0, respectively. A PMI reading above 50 indicates economic growth. A stable economy could provide a solid foundation for corporate fundamentals, and investors could continue to support equity and credit markets accordingly.
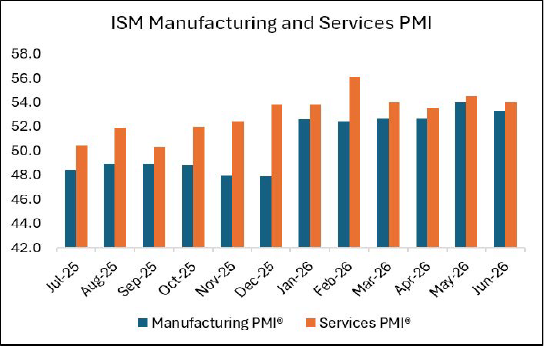
Source: Institute for Supply Management4,5
The U.S. economy and labor market are anticipated to remain supportive, but inflation is currently hovering above the Federal Reserve’s long-term target of 2%. The recent spike in energy prices, combined with heavy capital expenditures and demand tied to the artificial intelligence infrastructure buildout, suggests that inflationary pressures could stay for longer than anticipated. This may lead the Federal Reserve to maintain a tighter monetary policy for longer.
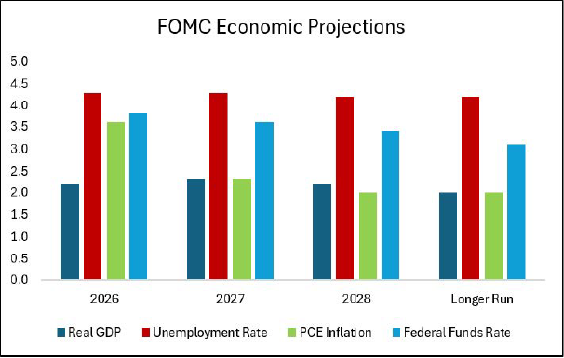
Source: Federal Reserve3
Chairman Warsh may be introducing an environment where market participants need to rely more on raw data rather than explicit central bank guidance. This structural shift in communication could result in higher uncertainty and more volatility in the bond markets.
New Fed Chairman and a Hawkish Tilt
Recent commentary from new Federal Reserve Chairman Kevin Warsh and other Fed governors indicates a potentially hawkish tilt and a desire to manage monetary policy to keep inflation in check. This leaves the door open for a potential rate hike rather than the series of rate cuts that market participants widely anticipated at the beginning of the year.
Chairman Warsh appears to favor a communication style that provides fewer explicit insights and less forward guidance than what investors grew accustomed to under his predecessor, Jerome Powell. By reducing this transparency, Chairman Warsh may be introducing an environment where market participants need to rely more on raw data rather than explicit central bank guidance. This structural shift in communication could result in higher uncertainty and more volatility in the bond markets.
Inflation has remained stubbornly sticky. The Personal Consumption Expenditures (PCE) price index excluding food and energy (Core PCE), serves as a key inflation metric for the Federal Reserve because it strips out volatile energy and food components to reveal long-term pricing trends. The May 2026 Core PCE Index reading showed an increase of 3.4% year-over-year, continuing an upward trend over the last few months.
The broader Consumer Price Index for May, which does include food and energy costs, jumped to 4.2% on a year-over-year basis. Both measures remain above the preferred 2% long-term inflation target set by the Federal Reserve.
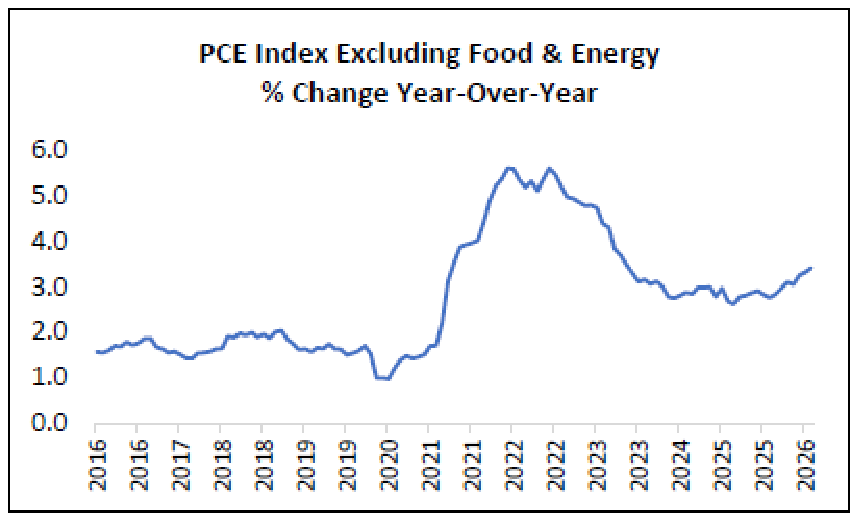
Source: U.S. Bureau of Economic Analysis. FRED.6
This persistent pricing pressure may ultimately force the Federal Reserve to either maintain the current federal funds rate target range of 3.50% to 3.75% or implement an additional rate hike to reduce inflation pressures. As it currently stands, the federal funds futures market is pricing in at least one rate hike before the end of the year. This is a significant reversal from the market narrative in early April, when investors were still pricing in a Fed rate cut.
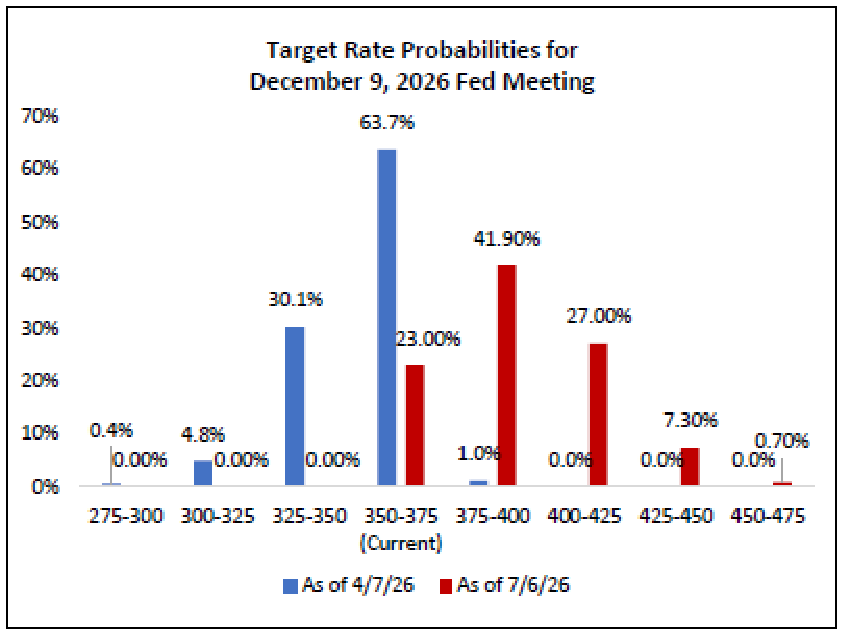
Source: CME Group7
Looking Ahead to the Second Half
It has been a strong start to the year for equity and bond investors, but macroeconomic uncertainties remain. The U.S.-Iran conflict has not been fully resolved. Questions regarding the return on investment for artificial intelligence initiatives are being raised. A potentially less transparent Federal Reserve under new Chairman Kevin Warsh and the upcoming U.S. midterm elections are key political factors investors will need to navigate.
If economic and corporate strength persists and investors can look past these short-term market uncertainties, they could continue to be rewarded as we move through the second half of the year.
To continue reading our Q2 2026 Quarterly Investment Commentary, click the image or button below.
SOURCES
1 Morningstar Direct. Performance provided as total returns. U.S. Mid Caps is defined by the Russell Mid Cap TR USD index. U.S. Small Caps is defined by the Russell 2000 TR USD index. U.S. Growth is defined by the Russell 3000 Growth TR USD index. U.S. Value is defined by the Russell 3000 Value TR USD index. International Developed is defined by the MSCI EAFE NR USD index. Emerging Markets is defined by the MSCI Emerging Markets NR USD index. U.S. Agg Bond is defined by the Bloomberg U.S. Aggregate Bond TR USD index. U.S. Investment Grade Corp is defined by the Bloomberg U.S. IG Corp USD 300 M TR USD Index. U.S. High Yield is defined by the Bloomberg High Yield Corporate TR USD index. Broad Commodities is defined by the Bloomberg Commodity TR USD index. WTI Crude Oil is defined by the Bloomberg Sub WTI Crude Oil TR USD Index. Gold is defined by the Bloomberg Sub Gold TR USD Index. Industrial Metals is defined by the Bloomberg Sub Industrial Metals TR USD Index. Short-Term Treasuries defined by the Bloomberg 1-3 Yr U.S. Treasury TR USD index. Intermediate-Term Treasuries defined by the Bloomberg Intermediate U.S. Treasury TR USD Index. Long-Term Treasuries defined by the Bloomberg Long-Term U.S. Treasury TR USD Index.
2 FactSet. Earnings Insight. 7/2/26.
3 Federal Open Market Committee. Summary of Economic Projections June 17, 2026
4 Institute for Supply Management. June 2026 ISM® Manufacturing PMI® Report https://www.ismworld.org/supply-management-news-and-reports/reports/ism-pmi-reports/pmi/june/
5 Institute for Supply Management. June 2026 ISM® Services PMI® Report https://www.ismworld.org/supply-management-news-and-reports/reports/ism-pmi-reports/services/june/
6 U.S. Bureau of Economic Analysis, Personal Consumption Expenditures Excluding Food and Energy (Chain-Type Price Index) [PCEPILFE], retrieved from FRED, Federal Reserve Bank of St. Louis; https://fred.stlouisfed.org/series/PCEPILFE, July 6, 2026.U.S. Bureau of Labor Statistics, All Employees, Total Nonfarm [PAYEMS], retrieved from FRED, Federal Reserve Bank of St. Louis; https://fred.stlouisfed.org/series/PAYEMS, April 6, 2026.
7 CME Group. FedWatch Tool. Retrieved 4/8/26 and 7/6/26 from https://www.cmegroup.com/markets/interest-rates/cme-fedwatch-tool.html
8 U.S. Treasury. Daily Treasury Par Yield Curve Rates https://home.treasury.gov/resource-center/data-chart-center/interest-rates/TextView?type=daily_treasury_bill_rates&field_tdr_date_value=2026
9 TradingView.com. WTI Crude Oil. Retrieved 7/8/26 from https://www.tradingview.com/chart/S5oI8Odc/?symbol=TVC%3AUSOIL
10 TradingView.com. Gold. Retrieved 7/8/26 from https://www.tradingview.com/chart/S5oI8Odc/?symbol=TVC%3AGOLD